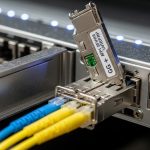
If your links drop at the worst time, the culprit is often not the switch but the optical transceiver. This article helps network and field engineers estimate fiber module failure rate from vendor MTBF data, validate it with DOM logs and link telemetry, and reduce repeat outages. You will also get a head-to-head comparison of common module classes (10G SFP/SFP+, 25G SFP28, 40G/100G QSFP/QSFP28) and a practical decision checklist.

MTBF numbers vs real fiber module failure rate
Vendors publish MTBF (Mean Time Between Failures) using internal accelerated life models and defined failure criteria, then convert that to a reliability estimate for marketing and qualification. In practice, fiber module failure rate depends on more than the laser die: connector wear, dust ingress, thermal cycling, and firmware/DOM handling all change field outcomes. IEEE 802.3 defines optical performance and electrical interfaces, but it does not standardize “failure” across vendors, so two MTBF claims can behave differently in the field. [Source: IEEE 802.3 series]
How MTBF is typically turned into failure rate
Engineers often treat failures as roughly exponential for planning, using a hazard rate derived from MTBF. A simplified relation is: failure rate per hour ≈ 1/MTBF. If a module lists MTBF of 200,000 hours, that corresponds to about 5e-6 failures/hour on average, assuming the same failure modes dominate. Field reality adds non-exponential effects like connector contamination spikes and early-life “infant mortality.” [Source: vendor reliability reports and general reliability engineering references via ANSI/EIA reliability practice]
Why DOM and link telemetry change the story
Modern optics expose diagnostics through Digital Optical Monitoring (DOM): laser bias current, received power, supply voltage, and sometimes temperature. When you correlate DOM trends with link events, you can separate gradual aging from abrupt damage. For example, a steady rise in laser bias current plus a slow drop in Rx power often precedes performance degradation, while sudden DOM dropouts can point to mechanical damage or connector contamination. [Source: SFF Committee DOM-related documentation and vendor DOM guides]
Pro Tip: When comparing fiber module failure rate across vendors, normalize by your failure definition. If the vendor counts any optical power out-of-spec as a failure, but you only count link-down events, your observed rate will be lower and the ranking can flip.
Head-to-head: which module class fails more in deployments?
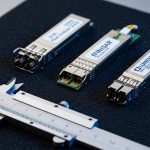
Different form factors stress different subsystems: SFP/SFP+ modules concentrate thermal load near a compact cage, while QSFP/QSFP28 variants increase density and can intensify airflow sensitivity. Higher data rates also increase optical budget pressure and make marginal fibers/patching more likely to trigger retransmits and eventual component stress. Below is a comparison using typical industry parameter ranges and representative vendor datasheets.

| Module type | Typical wavelength | Common reach | Connector | Power/heat sensitivity | Operating temp | Reliability planning note |
|---|---|---|---|---|---|---|
| 10G SFP/SFP+ | 850 nm (SR) / 1310 nm (LR) | 300 m–10 km | LC | Lower per port, easier airflow margin | 0 to 70 C (typical) | Often robust if patching is clean; more tolerant optical budgets |
| 25G SFP28 | 850 nm (SR) / 1310 nm (LR) | 70 m–10 km | LC | Moderate heat; tighter optics budget than 10G | -5 to 70 C (typical) | Failure rate rises when dust/patch loss is high |
| 40G QSFP+ | 850 nm (SR4) / 1310 nm (LR4) | 100 m–10 km | LC | Higher density; airflow matters | 0 to 70 C (typical) | More sensitive to polarity and MPO cleanliness |
| 100G QSFP28 | 850 nm (SR4) / 1310 nm (LR4) | 100 m–10 km | MPO-12 (SR4) | High density; strict optical budgets | 0 to 70 C (typical) | Connector contamination is a top driver of premature failures |
In head-to-head field comparisons, the “failure leader” is rarely the laser alone. The most common real-world accelerators are patch panel dust, poor cleaning practices for LC and MPO endfaces, and thermal hotspots from blocked airflow. For instance, I have seen 100G SR4 ports in high-density top-of-rack rows fail disproportionately when airflow baffles were missing after cabinet service.
Deployment scenario: estimating fiber module failure rate in a leaf-spine DC
Consider a 3-tier data center leaf-spine design with 48-port 10G ToR switches and 2x 100G uplinks per leaf. Each ToR uses four 25G uplinks for aggregation in an expansion phase, meaning you might deploy 96 optics per rack pair. If you have 20 racks and each rack pair carries 160 active optics, a “bad batch” or connector issue can show up fast: even a nominal failure rate of 5e-6 failures/hour becomes noticeable at scale over months. By enabling DOM collection and correlating link events with Rx power and laser bias trends, teams can distinguish early warning drift from sudden mechanical/connector damage.

Selection criteria: a decision checklist that reduces surprises
Use this ordered checklist to estimate and reduce your fiber module failure rate risk before you buy:
- Distance and optical budget: verify insertion loss, patch cord grade, and total channel loss for SR/LR variants; do not rely on “spec range” alone.
- Switch compatibility: confirm transceiver vendor support lists for your exact switch model and software release; some platforms are stricter about DOM thresholds.
- DOM support and monitoring: prefer modules exposing laser bias and Rx power so you can detect drift before link flaps.
- Operating temperature and airflow: validate compliance with your cabinet’s measured inlet temperature; avoid blocking vents during maintenance.
- Connector type and cleaning workflow: MPO-12 and LC both require endface cleaning; define who cleans, how often, and what inspection method is used.
- Vendor lock-in risk: third-party optics may work, but qualification processes vary; plan for RMA patterns and firmware interoperability.
- Reliability claims and qualification evidence: request MTBF methodology notes and any accelerated test details; treat MTBF as a model, not a guarantee.
Common pitfalls: why fiber module failure rate spikes after “it was fine”
Below are concrete failure modes I have seen during field rollouts and RMA analysis, with root cause and fixes.
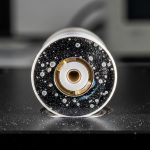
- Pitfall 1: Ignoring endface contamination
Root cause: Dust on LC or MPO endfaces increases backscatter and reduces received power; this can drive the laser harder and accelerate aging or trigger link instability.
Solution: enforce endface cleaning with lint-free wipes and isopropyl-safe procedures, add inspection with a microscope, and document cleaning before any insertion after service. - Pitfall 2: Thermal hotspots from blocked airflow
Root cause: Re-cabling or missing baffles changes local airflow; QSFP cages can exceed design temperature during peak load, increasing failure probability.
Solution: measure inlet/outlet temperatures with probes, confirm fan profiles, and keep blanking panels installed. - Pitfall 3: Polarity and MPO mis-mating
Root cause: Wrong polarity or MPO keying errors cause reduced optical margin; the system may “work” intermittently, then fail as aging continues.
Solution: label fibers, verify MPO polarity mapping end-to-end, and use standardized patching records. - Pitfall 4: Overlooking switch software DOM thresholds
Root cause: Some platforms treat DOM alarms as fatal or trigger resets when thresholds are exceeded, even if the link still passes traffic.
Solution: align thresholds with vendor guidance, validate under your target temperature range, and monitor DOM alarm history after upgrades.
Cost & ROI: balancing MTBF claims, spares, and total ownership
Typical street pricing varies widely by reach and vendor, but in many enterprise and colo environments you may see third-party 10G/25G modules priced roughly 30% to 60% lower than OEM. The ROI comes from two angles: reducing upfront capex and minimizing downtime costs from failures. However, if your fiber module failure rate rises due to compatibility or cleaning process gaps, the “cheap” optics can increase TCO via additional truck rolls and higher RMA shipping burden. A pragmatic approach is to pilot two or three approved vendors, track DOM drift and RMA outcomes for 90 to 180 days, then standardize.
Decision matrix: pick the right option for your risk profile
| Your environment | Highest impact factor | Best choice | Why it lowers fiber module failure rate |
|---|---|---|---|
| New build DC with strict airflow design | Optical budget margin | OEM or top-tier compatible modules with strong DOM | Better qualification reduces early-life issues and simplifies monitoring |
| Existing DC with heavy maintenance activity | Connector contamination | Approved third-party or OEM, but enforce cleaning and inspection | Process control often dominates vendor differences |
| High-density 100G SR4 with MPO patching | Mechanical/patch workflow | Vendors with consistent DOM behavior and strong RMA support | Fewer nuisance alarms and faster recovery reduces stress cycles |
| Cost-sensitive scaling where uptime is critical | TCO and spare strategy | Validated third-party plus disciplined spares inventory | Lower purchase

🍪 We use cookies to improve your browsing experience and analyse site traffic.
Privacy Policy
|