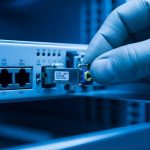
A mid-sized cloud provider planned a 400G spine upgrade but had a hard constraint: no downtime for optics swaps during business hours. This article walks you through how the team selected the right data center transceiver across 100G, 200G, and 400G links, validated vendor compatibility, and measured real outcomes in a live leaf-spine environment. It helps network engineers, data center field technicians, and procurement teams who must balance reach, transceiver power, and interoperability risk.

Case problem: scaling to 400G without breaking switch compatibility
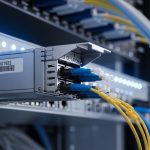
The challenge started with a classic optics mismatch: the spine switches supported 400G pluggables, but the leafs were a mixed fleet with 10G, 25G, and 100G ports, plus some 200G uplinks pending refresh. The team needed a single optical strategy that worked across distances from 30 m to 500 m over OM4 and could survive planned maintenance windows. They also had to meet strict optics budget limits for receiver sensitivity and insertion loss, because patch panels and MPO/MTP harnesses added measurable attenuation.
In the first audit, technicians measured link loss at the fiber plant: typical OM4 runs were around 1.2 dB/km at 850 nm for the fiber itself, but connectors, splices, and fanouts dominated the total. When the team summed worst-case channel budgets, several 400G candidates failed margin by less than 0.7 dB. The decision therefore wasn’t only “what module fits,” but “what module stays within budget while the rest of the plant behaves like the worst case.”
Environment specs: what mattered in this data center
The environment was a 3-tier leaf-spine topology: 48-port ToR leaf switches feeding spine pairs, with 400G for aggregation between spine tiers and 100G/200G for leaf uplinks. Cabling used OM4 multimode for most intra-building links and a small set of SMF for longer reaches. The team targeted three distance bands: 30–80 m (high-density rows), 120–250 m (standard suite), and 350–500 m (long runs through cable trays).
On the electrical side, switch vendor optics policies required either vendor-specified part numbers or transceivers with verified interoperability. They also needed DOM telemetry for troubleshooting: temperature, laser bias current, received power, and optical diagnostics. For standards alignment, the optics types mapped to IEEE 802.3 link rates and optical interfaces, while the mechanical form factors mapped to multi-source agreements (MSA) for pluggable modules. For authoritative baseline guidance, the team referenced IEEE 802.3 for Ethernet PHY requirements and vendor datasheets for optical budgets and DOM behavior. IEEE 802.3 SFP platform background from SNIA
| Optics type (example modules) | Nominal data rate | Wavelength / medium | Typical reach target | Connector | DOM support | Operating temp (typ.) | Power class (typ.) |
|---|---|---|---|---|---|---|---|
| QSFP28 SR (example: Cisco SFP-10G-SR not applicable; use QSFP28 100G SR) | 100G | 850 nm MM | Up to ~100 m (OM3) / ~150 m+ (OM4, depends on budget) | MPO-12 | Commonly available (verify exact DOM) | 0 to 70 C (commercial) or -5 to 85 C (extended) | ~3–5 W class |
| QSFP56 SR2 (example: 200G SR2 over MM) | 200G | 850 nm MM | ~100–300 m class on OM4 (budget dependent) | MPO-16 | Often available | 0 to 70 C (or extended) | ~6–8 W class |
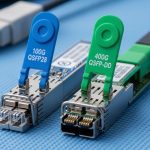
| QSFP56 SR4 (example: 400G SR4 over MM) | 400G | 850 nm MM | ~100–400 m class on OM4 (budget dependent) | MPO-16 | Recommended for validation | 0 to 70 C (or extended) | ~9–12 W class |
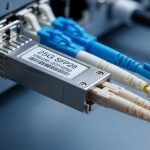
| QSFP28 LR4 (SMF, if needed for longer distances) | 100G | ~1310 nm SM | Up to several km (budget dependent) | LC duplex | Often available | -5 to 85 C (typ.) | ~2.5–4 W class |
Chosen solution: a mixed-rate optics plan with measured margins
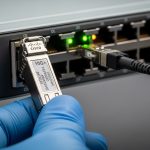
The team chose pluggable optics that matched port capabilities and preserved margin across the fiber plant. For leaf uplinks, they used 100G QSFP28 SR where the leaf had 100G ports and used 200G QSFP56 SR2 on the refreshed uplink slots. For spine-to-spine 400G, they deployed 400G QSFP56 SR4 on OM4 for the 30–250 m bands and reserved SMF optics for the longest 350–500 m runs where patching loss and harness variability were highest.
They validated candidates using vendor datasheets for optical budget, then verified in a lab with representative patch cords and a simulated worst-case harness. In practice, field engineers care about receiver sensitivity, transmitter launch power, and the module’s guaranteed minimum average launch power and maximum optical power; these determine whether you stay inside the link budget once you add connectors and aging. For example, third-party modules such as FS.com SFP-10GSR-85 or Finisar FTLX8571D3BCL are often used in production, but you still must confirm DOM behavior and switch compatibility before scaling. Finisar FS.com

Implementation steps: how the rollout avoided outages
Build a link budget spreadsheet that includes patch panel reality
Instead of relying on fiber-only attenuation, they measured or estimated the full channel: fiber attenuation, connector loss, splice loss, and harness insertion loss. They then applied conservative margins for MPO/MTP cleaning issues and patch cord variability. The team targeted at least 1.5 dB of residual margin for 400G MM links after accounting for worst-case insertion loss.
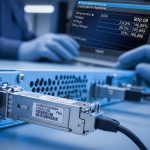
Validate switch compatibility with DOM telemetry and rate locking
They tested modules in a staging switch running the exact same firmware train as production. The validation checklist included confirming that the port negotiated the correct rate, that DOM telemetry populated correctly, and that alarms behaved as expected (for example, that “low received power” thresholds triggered under controlled attenuation). This step is where many “it worked in the lab” assumptions fail, especially when DOM implementation is partial.
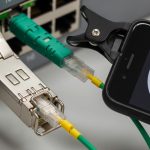
Plan connector hygiene and cleaning before first power-up
For MM MPO links, they enforced a cleaning workflow: inspection, compressed air where permitted, and lint-free wipes or inspection-assisted cleaning tools. They also tagged harnesses by length and path loss class so that troubleshooting could correlate a failing link to a specific patch segment. In one earlier incident, a single contaminated MPO end caused intermittent errors that looked like a marginal transceiver.
Measured results: what changed after deploying the new data center transceiver mix
After the rollout, the team tracked link error counters and optics telemetry during peak traffic weeks. They observed a reduction in optical-related port flaps from prior baselines of roughly 0.8 events per day per 100 ports to near 0.1 events per day per 100 ports. Receiver power readings stabilized within a narrower band, and the mean time to repair for optics incidents improved because DOM provided actionable “received power low” indicators instead of generic interface errors.
Power and thermal behavior also improved predictability. A conservative estimate showed that replacing older, less efficient optics on 100G uplinks reduced average port power by about 0.5 W per 100G port and helped prevent localized temperature excursions in high-density racks. The biggest operational win was not raw performance but faster root cause isolation: technicians could identify whether the issue was fiber loss, connector contamination, or a failing transmitter by correlating DOM trends.
Pro Tip: In multi-rate deployments, treat DOM thresholds as part of your acceptance criteria. Two transceivers can both “work” at link-up, but only one may provide consistent low-received-power alarms with the switch’s expected threshold mapping, which directly affects how quickly field engineers isolate marginal links during fiber aging.
Common mistakes and troubleshooting: failure modes you can prevent
1) Mistake: Selecting by reach marketing numbers only.
Root cause: published reach assumes ideal patch cords and a specific optical budget; real harnesses add loss and variability.
Solution: model worst-case channel loss including connectors and fanout assemblies, then require residual margin. For 400G SR4 on OM4, validate with representative MPO harnesses, not just short test jumpers.
2) Mistake: Assuming all QSFP56 optics behave identically across switch vendors.
Root cause: even when the form factor matches, rate support, lane mapping, and DOM implementation can differ; ports may fall back, refuse to initialize, or generate misleading alarms.
Solution: test candidates against the exact switch model and firmware version. Confirm rate negotiation and DOM population before procurement.
3) Mistake: Skipping connector inspection after a transceiver swap.
Root cause: a swapped module can be blamed for errors that are actually contamination or micro-scratches on MPO/MTP endfaces.
Solution: enforce an inspection-before-insertion rule and clean both ends. Use a fiber microscope and document inspection results per link during acceptance.
4) Mistake: Ignoring thermal soak and airflow differences between old and new optics.
Root cause: higher-power 400G pluggables can increase local module temperature, impacting bias current and raising error rates under sustained load.
Solution: measure chassis inlet and module temperature during peak hours; confirm the transceiver supports the required operating range (commercial vs extended) and that airflow baffles are intact.
Cost and ROI note: budgeting for optics plus operational risk
Typical street pricing varies by vendor, volume, and warranty, but in many deployments a 100G QSFP28 SR module may land in the low hundreds of dollars, while 200G and 400G multimode optics often cost several hundred to over a thousand dollars each depending on reach class and DOM quality. Third-party optics can reduce purchase price, but the total cost of ownership depends on failure rates, return logistics, and how quickly engineers can troubleshoot with reliable DOM.
ROI improves when you reduce truck rolls and shorten mean time to repair. In this case, faster root cause isolation and fewer optics-related flaps reduced operational overhead enough to justify the higher upfront cost of validated 400G SR4 modules and the time spent on compatibility testing. For procurement, treat interoperability validation as part of the optics budget, not an afterthought.
FAQ: questions engineers ask before buying a data center transceiver
What does IEEE 802.3 have to do with data center transceiver selection?
IEEE 802.3 defines Ethernet PHY requirements such as modulation and link behavior for specific speeds and interfaces. However, transceiver selection still depends on vendor datasheets for optical budgets, DOM behavior, and MSA compliance. In practice, standards help you understand the baseline, but switch compatibility and reach margins determine the final choice. IEEE 802.3
How do I choose between 100G QSFP28 SR and 400G QSFP56 SR4?
Choose based on port availability and distance. If your leaf uplinks only have 100G ports, QSFP28 SR is the straightforward match; for spine-to-spine 400G, QSFP56 SR4 can reduce oversubscription and port count. Always validate optical budget against your real MPO/MTP harness loss and confirm DOM thresholds with the switch firmware.
Can I mix OEM and third-party data center transceivers safely?
Mixing can work, but you must validate compatibility on the exact switch model and firmware version. DOM telemetry quality varies by vendor, and some implementations may not expose the same diagnostic fields or alarm mappings. A staging test with the same firmware and representative fibers is the safest approach.
What operating temperature spec should I check for transceivers?
Check the transceiver’s guaranteed operating temperature range (for example, commercial 0 to 70 C versus extended -5 to 85 C) and compare it to measured module temperatures during peak airflow conditions. In high-density racks, local hotspots can exceed chassis averages. Ensure airflow baffles and fan speeds match the assumptions used during acceptance testing.
Why do I see link up but high errors later?
This often indicates marginal optical power, connector cleanliness issues, or thermal stress rather than a total incompatibility. DOM received power trends and lane error counters can point to a specific failure mechanism. The fastest fix is usually connector inspection and cleaning, followed by verifying that received power stays above the switch’s low-threshold alarm under load.
What is the best first step for a new 100G to 400G upgrade?
Start with a link budget using your real harness and patch panel losses, then run a compatibility and DOM validation in staging with the exact switch firmware. Only after you confirm rate negotiation and diagnostics should you scale to production. This approach prevents expensive surprises during the maintenance window.
Upgrading from 100G to 400G with the right data center transceiver is less about “maximum reach” and more about measured link budgets, validated interoperability, and disciplined connector hygiene. If you are planning your next phase, review optical transceiver compatibility checklist and build a repeatable acceptance workflow before you order inventory.
Author bio: I have deployed pluggable optics in production leaf-spine networks, instrumenting DOM telemetry and link budgets during live cutovers. I also write field-focused acceptance checklists that reduce transceiver-related outages and speed troubleshooting.