In a leaf-spine fabric or a campus core running 10GBASE-SR or 25GBASE-SR, optical interference can quietly convert clean BER into intermittent packet loss, CRC errors, and link flaps. This article helps network engineers and field technicians troubleshoot optical interference using practical checks on optics, fiber plant, and switch diagnostics. You will get a step-by-step implementation path, a spec comparison table for common SR optics, and a failure-mode checklist grounded in real deployment patterns.
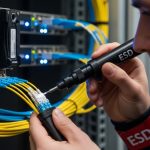
Pro Tip: If errors correlate with specific patch cords or with a single tray movement, treat the problem as a physical-layer disturbance first (connector micro-geometry, bend radius, or dirty ferrules) rather than “bad optics.” Most “mystery interference” cases resolve when you clean and reseat at the exact endpoints and verify launch power and receiver power against the module datasheet.
Prerequisites: what to measure before you touch optics

Before you start swapping transceivers, collect the measurements that pinpoint whether the issue is coherent noise, reflection-induced penalty, or plain attenuation. Optical interference in short-reach links is often triggered by reflections (improper mating, dirty ferrules, damaged connectors) or modal disturbance (tight bends, poor patching practices). Use the switch interface counters and optical diagnostics together so you can distinguish transient impairment from a persistent margin problem. For Ethernet PHY alignment and error behavior, reference IEEE 802.3 operational guidance and test concepts. IEEE 802.3 Ethernet Standard
Tools and access
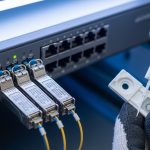
- Managed switch or router with transceiver telemetry (DOM): RX power, TX power, temperature, and vendor alarms.
- Fiber inspection scope (ideally 400x to 1000x) and lint-free wipes plus isopropyl-free cleaner.
- Known-good patch cords in the same connector type (LC/UPC or LC/APC where applicable).
- Bend radius gauge or a way to verify cable routing against vendor guidance.
- Optional: optical power meter and light source if you must validate link budget outside DOM.
Baseline data to capture
Record the interface name, module part number, and DOM telemetry at the moment errors appear. Capture CRC, FCS, symbol errors (if available), and link-down/link-up timestamps. Also note whether the behavior is tied to temperature swings, physical movement, or a specific patch panel row. This turns troubleshooting from guesswork into a repeatable diagnostic workflow.
Step-by-step implementation: isolate optical interference fast
Use the following numbered steps like a field runbook. Each step includes an expected outcome so you know what “good” looks like and when to escalate. The goal is to separate reflection and contamination issues from true link budget problems and to confirm whether optical interference is localized to one endpoint.
Confirm the failure signature and scope
Expected outcome: you should determine whether the link is flapping, showing only error counters, or failing at a stable link state. Start with the switch CLI and pull per-interface counters for the last hour and since last reset. If your platform supports it, record PCS/BERT or equivalent physical-layer error counters. If the switch provides event logs, correlate error spikes with any patching activity.
- If you see link flaps with short up/down cycles, suspect connector seating, cleanliness, or transceiver compatibility.
- If you see rising CRC/FCS without flaps, suspect optical margin reduction, tight bends, or partial contamination.
- If you see errors only after rerouting or after someone touches the cable tray, suspect physical disturbance creating interference through reflections or modal perturbation.
Compare DOM telemetry against module datasheet limits
Expected outcome: confirm whether the receiver is operating within the specified power range and whether the module reports any alarm states. Pull DOM for both sides of the link if you can. Many SR optics are rated for a typical optical budget, and interference symptoms often appear when RX power is drifting near a threshold due to attenuation or connector damage.
Focus on:
- RX power and whether it is stable or oscillating.
- TX power changes that might indicate aging optics.
- Temperature and whether it tracks error bursts.
- Vendor alarms such as laser bias current or receiver loss-of-signal.
Validate optics compatibility and lane mapping
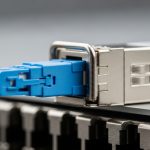
Expected outcome: both ends should match the intended standard and physical mapping. For 10GBASE-SR, optics are typically 850 nm multi-mode using LC connectors and a specific fiber type. For 25GBASE-SR, ensure you are using the correct lane configuration and that you have the right polarity mapping (especially in breakout or MPO scenarios). Mis-mapped lanes can look like interference because some lanes are heavily penalized while others appear stable.
Practical checks:
- Confirm transceiver part numbers (example: Cisco SFP-10G-SR, Finisar FTLX8571D3BCL, or FS.com SFP-10GSR-85) and that they are within the platform compatibility list.
- If using QSFP/QSFP28 with MPO, verify polarity using a polarity kit designed for the exact breakout method.
- Ensure the switch expects the same speed mode and breakout profile.
Inspect and clean the exact endpoints that terminate the link
Expected outcome: after cleaning and reseating, error counters should drop or stop increasing. Optical interference often comes from micro-dust or film on the ferrule endface that creates extra reflections and reduces effective signal-to-noise ratio. Clean both ends even if the problem “seems” remote; reflections can travel and still degrade the transmitter’s received margins.
Procedure:
- Inspect the LC/SC endfaces with the scope before cleaning.
- Clean using a lint-free method consistent with your fiber cleaning kit instructions.
- Reinspect after cleaning; if you see hazing or scratches, replace the patch cord or connector.
- Reseat once with consistent pressure; avoid repeated “dry” insertion without cleaning.
Check fiber routing for bend radius and strain events
Expected outcome: you will find at least one cable run violating bend radius or experiencing side loading during tray movement. In high-speed SR links, tight bends and strain can induce modal disturbance and increase coupling into higher-order modes, effectively raising noise and causing intermittent CRC errors. If the link degrades after someone moves the patch cords, this step is usually the turning point.
- Look for cable ties placed too tightly around the jacket.
- Verify that patch cords are not sharply kinked at the rack edge.
- Confirm no tension is applied to the connector body (strain relief matters).
- Keep patch cords away from airflow grilles that can vibrate in some environments.
Swap one variable at a time using known-good components
Expected outcome: you can localize the issue to a patch cord, a bulkhead adapter, a transceiver, or the fiber run. Replace the patch cord with a known-good cord and retest. If you can, swap optics on one end only first; then swap the other end. This avoids confusing the symptom with the cause.
When swapping:
- Prefer the same connector and fiber grade (OM3 vs OM4 vs OM5) if your vendor allows it.
- Use identical data rate modules (10G vs 25G) and confirm speed negotiation behavior on the switch.
- Wait for counters to accumulate after each change (at least 15 minutes for intermittent issues).
Validate link budget with measured optical power if DOM is unclear
Expected outcome: measured RX power should align with the expected link budget after accounting for connectors and splices. DOM is helpful but not a substitute for an external measurement when you suspect calibration drift or when DOM readouts look inconsistent across vendors. If you have an optical power meter, measure TX launch power and RX receive power at the endpoints.
Then compare your total loss to the module and fiber plant assumptions. In many SR deployments, connector loss and patch cord loss dominate the budget, and a single damaged adapter can remove your margin and amplify optical interference effects.
Common SR optics specs: where interference sensitivity differs
Not all SR modules behave the same under reflection noise. While wavelength and nominal reach are often advertised, technicians should also consider optical interface type, connector, and typical operating temperature range because receiver sensitivity and margin can vary across vendors and generations. The table below gives a practical comparison for typical 850 nm SR modules commonly used in data centers.
| Module family (examples) | Data rate | Wavelength | Typical reach on OM4 | Connector | Operating temperature | Power/telemetry |
|---|---|---|---|---|---|---|
| SFP-10G-SR class (e.g., Cisco SFP-10G-SR) | 10G | 850 nm | ~300 m | LC | 0 to 70 C typical | DOM with TX/RX power |
| SFP+ / SFP-10G-SR class (e.g., Finisar FTLX8571D3BCL) | 10G | 850 nm | ~300 m on OM4 | LC | -5 to 70 C typical | DOM with alarms |
| QSFP28-25G-SR class (25G SR) | 25G | 850 nm | ~100 m on OM4 (typical) | LC or MPO (model dependent) | 0 to 70 C typical | DOM with higher-speed diagnostics |
Selection implication: at higher data rates (25G and beyond), the receiver margin tightens and even small reflection events can trigger higher error rates that look like optical interference. That does not mean 10G is immune; it means your tolerance for dirty ferrules, poor polarity, and bend-induced modal disturbance is smaller.
For optical link concepts and general fiber performance parameters used in network testing, consult ITU guidance on optical fiber and system performance concepts. ITU-T Publications
Selection criteria: how to choose optics and cabling to reduce recurrence
When you are past the immediate outage and planning the next procurement cycle, the right selection criteria prevents repeat incidents. Use this decision checklist in order, because it reflects how optical interference typically reappears after “successful” repairs.
- Distance and link budget margin: confirm your actual fiber length plus patch cord and adapter loss. Build margin so RX power stays comfortably within module specs.
- Switch compatibility: validate transceiver part numbers against the switch vendor compatibility list to avoid unexpected PHY behavior.
- Connector and cleaning discipline: prefer standardized LC/UPC or LC/APC usage consistent with your plant, and enforce inspection before installation.
- DOM and diagnostic granularity: choose modules that expose TX/RX power and alarm thresholds clearly so you can detect drift early.
- Operating temperature range: verify suitability for aisle temperatures and enclosure heat loads; thermal drift can reduce receiver margin.
- Fiber type and modal performance: ensure OM3/OM4/OM5 selection matches the module rating, and ensure routing practices respect bend radius.
- Vendor lock-in risk: evaluate OEM-only optics versus third-party availability, but require consistent DOM behavior and documented compliance.
For practical fiber installation and inspection practices that reduce optical-layer faults, the Fiber Optic Association provides field-oriented guidance you can align with your internal procedures. Fiber Optic Association
Common mistakes and troubleshooting tips for optical interference
Below are the top failure modes seen in high-speed SR links. Each includes a root cause and a concrete fix so you can act without rework loops.
Cleaning the wrong end or skipping post-clean inspection
Root cause: technicians clean only one connector or trust a “looks clean” check. Micro-contamination and scratches remain and continue to create reflection penalty, which behaves like optical interference.
Fix: inspect both ends before and after cleaning; replace any connector or patch cord with visible scratches or persistent haze.
Tight bends and cable tray movement ignored during “optics swap”
Root cause: swapping optics temporarily changes power levels and can mask the issue, but modal disturbance persists. When the tray is moved, the interference pattern returns and errors resume.
Fix: re-route cables to meet bend radius guidance; add slack where needed; secure cable ties so they do not compress the jacket at sharp edges.
MPO polarity errors on 25G breakout links
Root cause: incorrect polarity or reversed fiber mapping causes certain lanes to receive attenuated or reflected signals. This can look like random interference because some lanes are intermittently above the receiver threshold.
Fix: verify polarity using the exact polarity method for your MPO breakout standard; replace polarity adapters if you cannot prove mapping with inspection and labeling.
Mixing OM3 and OM4 runs without confirming module rating
Root cause: some modules support specific fiber grades and launch conditions. A mixed plant can produce variable performance that appears intermittent, especially during temperature changes.
Fix: confirm module datasheet fiber grade support; standardize patch cords and confirm bulkhead adapters route to the expected fiber type.
Cost and ROI: balancing OEM vs third-party optics under interference risk
In procurement terms, optical interference incidents cost more than the optics themselves because they generate labor, downtime, and repeat truck rolls. Typical street pricing varies widely by vendor and data rate: 10G SR SFP/SFP+ often ranges roughly from $40 to $120 per module, while 25G SR QSFP28 can be $120 to $300+ depending on reach and DOM quality. OEM optics frequently carry higher unit cost but may reduce compatibility surprises and provide more predictable DOM alarm behavior; third-party optics can be cost-effective when you validate compatibility and require documented compliance.
TCO model: include expected failure rate and mean time to repair. If your environment has higher contamination risk (frequent moves, dense cabling, or weak cleaning discipline), spending on better inspection workflow and standardized patch cords often yields higher ROI than chasing the cheapest transceiver. Also account for power usage: modern optics have relatively small differences per port, but reducing rework and lowering replacement frequency drives the real savings.
FAQ
How do I confirm the problem is optical interference and not just attenuation?
Look for symptoms that correlate with physical movement, connector reseating, or tray vibration. Also compare DOM RX power stability: attenuation tends to be steady and low, while interference often shows intermittent spikes in errors with stable average RX power.
Do I need to replace the transceiver if errors persist after cleaning?
Not immediately. Clean and verify fiber routing first, then swap one known-good component at a time. Replace optics only after you confirm the receiver and transmitter diagnostics are within spec and the issue follows the optics when swapped.
What fiber inspection findings most often cause interference-like errors?
Common culprits include visible soot, film, micro-scratches on the ferrule face, and damaged connector end geometry. If post-clean inspection still shows hazing or scratches, replacement is usually faster than repeated cleaning attempts.
Can switch settings worsen optical interference?
Yes indirectly. Incorrect speed mode, breakout profile mismatches, or polarity misconfiguration can reduce lane margin and make reflection noise more harmful. Verify the interface configuration matches the module and cabling standard.
Is optical interference more common at 25G than 10G?
It is more likely to become visible at higher data rates because receiver margin tightens and the system is less forgiving of reflection penalty and modal disturbance. However, the root causes are often the same: contamination, reflections, bend radius violations, and polarity errors.
Should we standardize patch cords to reduce future issues?
Yes. Standardizing connector types, fiber grade, and labeling, plus enforcing scope-based inspection before installation, reduces variability that leads to intermittent optical interference incidents.
If you want to operationalize this, start by implementing a repeatable endpoint inspection and routing verification workflow, then validate DOM telemetry against module specs. Next, use fiber optic transceiver compatibility to tighten procurement and reduce compatibility-related optical margin surprises.
Author bio: I am a field-tested procurement and deployment specialist who has troubleshot SR transceiver and fiber plant issues in production data centers using DOM telemetry, connector inspection, and controlled swap methodologies.
Author bio: I focus on measurable link-budget risk, compatibility validation, and supply chain choices that reduce repeat failures and improve mean time to repair.