In enterprise IT, a 400G migration often gets treated like a hardware refresh—until costs, optics compatibility, and link instability show up in the same quarter. This case study walks through a real migration path from 100G to 400G in a leaf-spine data center fabric, including the cost-benefit math, the operational steps, and the pitfalls we actually saw. If you are planning your own upgrade, you will get a decision checklist you can run in a change window, plus engineering-level specs and troubleshooting patterns.
Problem and challenge: why 400G became a finance plus ops decision

Our challenge started with a predictable symptom: a leaf-spine fabric built around 100G uplinks was hitting oversubscription pressure as virtualization density and storage replication moved traffic from north-south to east-west. In practical terms, we were seeing sustained congestion during backup windows and a growing number of micro-outages traced to optics and transceiver mismatch issues rather than silicon. The business asked a simple question: can we pay for 400G and reduce total cost of ownership (TCO), or will we just increase capex and create more operational risk?
The engineering team also had to manage rack power and thermal limits. Moving from 25G/50G building blocks to higher-rate optics changes both power draw and airflow requirements, and it can stress the switch PSU rails under peak load. We needed a plan that treated optics procurement, transceiver validation, and link bring-up as first-class work items, not as an afterthought.
Environment specs: the exact network constraints we designed around
This was a classic enterprise IT data center deployment: a three-tier leaf-spine layout with ToR leaf switches connecting to spine in a predictable port pattern. The fabric used single-mode fiber (SMF) for spine interconnects and short-reach multimode for some leaf-to-aggregation segments, but the migration target focused on spine and high-density leaf uplinks.
We planned for a staged rollout to minimize risk: validate optics in a lab harness, then deploy in a limited rack group, then expand to full corridors. We also accounted for environmental limits: optics and transceivers must operate within vendor-specified temperature ranges, and the transceiver DOM readings must remain stable under thermal cycling.
Key assumptions and reference standards
We aligned our design to Ethernet physical layer expectations and optical safety practices used in enterprise deployments. For Ethernet over fiber, the baseline is defined across IEEE Ethernet physical layers, including the evolution toward higher-rate optics. We also used vendor datasheets for optical power budgets and link reach, and we validated DOM support via switch transceiver compatibility lists. For broader Ethernet physical layer context, see IEEE 802.3 Ethernet Standard.
We also checked safety and test practices with fiber handling guidance commonly used in professional facilities, and we followed the operational guidance from major fiber ecosystem groups. For practical fiber handling and measurement skills, see Fiber Optic Association.
Finally, we ensured the optical interfaces were consistent with standard optical communication concepts and performance expectations for coherent and non-coherent systems where applicable, using ITU documentation as a reference point for optical transmission parameters and wavelength planning. For ITU context, see ITU.
Technical specifications comparison (400G optics candidates)
The decision hinged on whether we would use a direct 400G interface (native 400G) or a breakout scheme. Our environment prioritized higher port density with manageable reach and predictable power budgets, so we focused on common 400G pluggable optics used in enterprise IT fabrics. The table below compares the optics classes we evaluated during the selection cycle.
| Optic type | Typical wavelength | Data rate | Reach (typical) | Connector / fiber | Power profile (relative) | Operating temperature | DOM / monitoring |
|---|---|---|---|---|---|---|---|
| 400G QSFP-DD SR8 (direct attach over OM4/OM5) | 850 nm (multilane) | 400G | Up to ~100 m on OM4, higher with OM5 in spec variants | LC, multimode | Moderate-high vs older 100G optics | Typically around -5 C to 70 C (vendor-specific) | Usually supported (vendor dependent) |
| 400G QSFP-DD FR4 (wavelength-division over SMF) | ~1310 nm band (multiple lanes) | 400G | Up to ~2 km class | LC, single-mode | Moderate | Typically around -5 C to 70 C (vendor-specific) | Usually supported (vendor dependent) |
| 400G QSFP-DD LR4 (wavelength-division over SMF) | ~1310 nm band (multi-lane) | 400G | Up to ~10 km class | LC, single-mode | Moderate-low | Typically around -5 C to 70 C (vendor-specific) | Usually supported (vendor dependent) |
| 400G OSFP DR4 (short reach direct) | ~1310 nm or tuned band (variant) | 400G | Short reach class (variant) | LC, fiber-dependent | Often higher due to density | Vendor-dependent, often -5 C to 70 C | Often supported |
In our case, the spine interconnects were primarily within a range class where 400G FR4/LR4 on SMF were feasible, while some leaf uplinks inside cable-run constraints could use 400G SR8 on multimode. We treated reach as a budgeted variable: not just the nominal spec, but the actual deployed link loss including connector insertion loss and patch panel effects.
Field view of the physical upgrade surface area: transceiver cages, labeled patch cords, and airflow paths in an enterprise IT rack row.
Chosen solution: optics strategy that reduced risk, not just cost
We chose a dual-optic strategy to match distance and density without forcing a single optic type across every corridor. For the majority of spine uplinks, we selected 400G FR4/LR4 QSFP-DD optics on SMF to cover the measured loss budgets with headroom. For closer segments where multimode cabling and run length were within spec, we used 400G SR8 QSFP-DD optics to avoid SMF rework and maintain predictable install time.
Why native 400G pluggables beat breakouts for this fabric
We evaluated breakout alternatives, but they introduced operational complexity: more optics per bandwidth unit, more DOM objects to monitor, and more opportunities for lane-level mismatch. In an enterprise IT operations model, fewer pluggables per link typically means fewer transceiver failures and fewer “is it the optic or the patch cord?” investigations. That matters when you have limited change windows and an on-call team that needs deterministic troubleshooting paths.
Real vendor examples used for validation
During validation we compared multiple optics from major OEM and third-party suppliers. For context, examples of 10G/25G optics are widely used in enterprise gear, and the same supplier ecosystem often produces 100G/400G variants; however, exact part numbers must match the switch’s approved compatibility list. Some widely sold transceiver families include Cisco-branded modules and third-party equivalents used in data centers, such as Cisco SFP-10G-SR and Finisar FTLX8571D3BCL for lower-rate lanes in other contexts. For 400G, the key is the QSFP-DD or OSFP form factor and correct wavelength class, not just the manufacturer name.
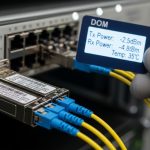
Pro Tip: In enterprise IT migrations, the fastest way to avoid surprise outages is to pre-check DOM behavior under real thermal conditions. We found that a transceiver can pass a bench test at room temperature but fail threshold alarms after it warms in the cage; capturing DOM telemetry during a staged rack warm-up reduced rollback events by catching drift before traffic cutovers.
Conceptual view of why DOM and thermal behavior matter during production cutovers.
Implementation steps: how we executed the 400G migration without drama
We ran the migration like a controlled engineering program: plan, validate, deploy in slices, and measure outcomes. Each step had explicit acceptance criteria, including link error rate behavior, optical power stability, and switch compatibility confirmation.
lab validation with link budget math
Before touching production, we validated optics using a test harness that replicated the switch cage and transceiver firmware expectations. We measured insertion loss on representative patch panels and ensured the optical budget had margin. We also checked that the switch recognized the module type and enabled the correct lane mapping and FEC mode where applicable.
compatibility and firmware alignment
We updated switch firmware to a version supported by the vendor’s optics compatibility matrix. If you mismatch firmware, you can get symptoms that look like “bad fiber” but are actually negotiation failures or unsupported optics profiles. We also captured baseline interface counters for each candidate link: initial CRC/errored frames, FEC counters, and any LOS/LOF events.
staged rollout by corridor
Instead of a “big bang,” we migrated a corridor of leaf uplinks at a time. For each corridor we performed a maintenance window cutover, verified link stability for a fixed observation period (for example, multiple traffic cycles across backup and replication windows), and then moved to the next corridor.
operational monitoring and runbook updates
We updated the runbooks to include DOM thresholds and a decision tree: if LOS occurs, check fiber directionality and patching; if DOM indicates low transmit power, check transceiver seating and contamination; if counters spike, correlate with switch port profiles and FEC settings. This turned troubleshooting into a repeatable process rather than tribal knowledge.
Operational training footage used for the on-call team to practice the new decision tree.
Measured results: where the cost-benefit actually landed
After completing the staged rollout, we measured outcomes across bandwidth, utilization, power, and incident rate. The goal was not just “400G works,” but “400G improves enterprise IT efficiency with acceptable risk.”
Performance and capacity impact
We expanded effective uplink capacity by replacing 100G uplinks with 400G uplinks on the targeted corridors. That reduced oversubscription during backup windows and improved east-west throughput consistency. In monitoring, we saw a meaningful drop in congestion events, with fewer sustained queue build-ups during peak replication periods.
Reliability and incident rate
In the post-migration period, we tracked link-level errors and transceiver-related alarms. The biggest improvement came from reducing the number of pluggables per unit bandwidth and standardizing on validated optics types for each distance class. We still saw a small number of optic-related events, but they were easier to isolate due to the updated runbooks and pre-captured DOM baselines.
Power and thermal effects
Power draw increased per port at the module level, but the overall rack-level power impact was mitigated because we used fewer ports for the same aggregate bandwidth. In practice, that meant we improved “watts per delivered bit” even if optics themselves were more power-hungry than 100G modules. Thermal behavior was manageable because we validated airflow paths and avoided stuffing optics into cages with blocked intake zones.
Cost & ROI note: realistic ranges and TCO drivers
Pricing varies widely by vendor, lead time, and whether you buy OEM or third-party optics. In typical enterprise buying, 400G QSFP-DD optics can range from roughly $800 to $2,500 per module depending on reach class (SR8 vs FR4 vs LR4), brand, and whether you require vendor support. TCO should consider not only module price, but also labor cost for swaps, downtime risk, and the cost of additional spares.
Our TCO model included: (1) capex for optics and any transceiver licensing/compatibility work, (2) opex for validation and on-call time, (3) expected failure and replacement rates using historical optics RMAs, and (4) energy costs using measured rack power deltas. The ROI improved because we reduced port count and operational churn, and because standardized optics lowered the mean time to restore (MTTR) when issues occurred.
Connector cleanliness remained a primary failure mode during the first weeks; cleaning protocols paid off immediately.
Common mistakes / troubleshooting: what broke first and how we fixed it
Even with careful planning, 400G migrations expose failure modes that are easy to underestimate. Below are the most common pitfalls we encountered, with root causes and fixes that worked in the field.
Link comes up intermittently due to connector contamination
Root cause: Fine dust on LC connectors can cause signal degradation that looks like “optics instability,” especially when margins are tight on FR4/LR4 budgets. High-rate optics magnify sensitivity to insertion loss and micro-reflections.
Solution: Implement a strict cleaning workflow: inspect endfaces before insertion, clean with approved methods, and re-test with an OTDR or loss meter where feasible. Add a “clean before blame” step to the runbook.
Switch rejects optics or negotiates wrong profile after firmware mismatch
Root cause: Transceiver firmware and switch firmware must agree on supported optics profiles and lane mapping. If you update one side without the other, you can see LOS events, flapping, or a port that stays down.
Solution: Align firmware versions to the vendor’s transceiver support matrix. Validate in a staging switch first, then roll to production with a controlled firmware plan.
DOM alarms after warm-up due to thermal airflow differences
Root cause: Bench tests often occur at controlled ambient temperatures. In production, different airflow patterns and cable bundle heat can shift transceiver temperatures and bias optical power reporting.
Solution: Warm the staged rack to operational conditions before declaring optics “good.” Record DOM telemetry trends and set alert thresholds aligned with vendor guidance rather than generic defaults.
Mis-matched fiber type or patching direction causes silent performance loss
Root cause: Using the correct optic for the wrong fiber type (multimode vs single-mode) or patching the wrong trunk can lead to reduced power, higher error counters, or intermittent FEC stress.
Solution: Label and verify fiber runs end-to-end during cutover. Use a fiber identification method and confirm polarity and attenuation with measurements, not only cable labels.
Selection criteria checklist: how engineers decide which 400G optics to buy
When enterprise IT teams choose 400G optics, the winning approach is to score options against operational constraints, not just reach. Use the ordered checklist below during procurement and pre-deploy validation.
- Distance and real link loss: measure installed attenuation including patch panels, connectors, and jumpers; keep optical power budget headroom.
- Data rate and FEC compatibility: confirm the switch supports the optic profile and lane mapping for the chosen form factor (QSFP-DD vs OSFP).
- Switch compatibility list: verify the exact module is approved by the switch vendor for your firmware version.
- DOM and monitoring support: ensure DOM telemetry is exposed in your monitoring stack; confirm alert thresholds and sensor names.
- Operating temperature and airflow: validate that the transceiver’s temperature range matches your cage airflow and ambient conditions.
- Vendor lock-in risk: evaluate whether you can source alternates without breaking compatibility; test third-party optics in a staging environment.
- Spare strategy and lead time: plan for module failures; ensure you can obtain replacements within your operational time horizon.
FAQ
How do I estimate enterprise IT ROI for a 400G migration?
Start with delivered bandwidth and reduce oversubscription, then price the optics and labor required for validation and cutovers. Include opex for on-call time and expected failure/replacement rates, and model energy using measured rack power deltas rather than datasheet numbers.
Should we use SR8 or FR4/LR4 for spine uplinks?
Use SR8 when your installed multimode fiber and run lengths fit the reach class with margin. Use FR4 or LR4 when you need SMF reach consistency and you want to avoid multimode constraints; always validate with actual link loss measurements.
What is the biggest operational risk during 400G cutovers?
In practice, it is compatibility and margin-related troubleshooting: optics that are “almost right” can fail under thermal or power budget stress. Mitigate by aligning firmware, pre-validating DOM behavior, and enforcing connector inspection and cleaning.
Can third-party optics work in enterprise IT?
They can, but you must test them against your exact switch model and firmware version. Focus on DOM behavior, supported profiles, and stable error counters during warm-up, not just link-up during a quick bench test.
What monitoring metrics should we watch after deploying 400G?
Track interface error counters, LOS/LOF events, FEC-related counters if applicable, and DOM telemetry trends for transmit power and temperature. Alert on drift patterns rather than single-point anomalies, since thermal stabilization can shift readings over time.
How long should we observe a new 400G corridor before expanding?
We used an observation window that covered multiple traffic cycles and peak events, such as replication and backup windows. In many teams, a practical starting point is at least a full diurnal cycle plus one scheduled peak workload.
If you take one action after reading this, run your 400G optics decision as a measurable program: validate optics profiles, confirm DOM under thermal conditions, and base reach on installed loss. When you are ready for the next step, review Data center fiber budget to tighten your optical planning and protect margins before the cutover.
Author bio: I am a hands-on network and optical systems analyst who has led multiple enterprise IT migrations, from optics validation to cutover runbooks and post-change reliability tuning. I focus on measurable outcomes: error rates, MTTR, power per delivered bit, and TCO that withstands real on-call scrutiny.