A modern data center does not just want faster links; it wants links that behave like well-trained employees. This article shows how the benefits of AI-enabled networking show up in day-to-day operations when you choose intelligent fiber transceivers with telemetry, DOM support, and predictable optics. It is written for network engineers, field technicians, and procurement folks who have ever chased a flaky link at 2 a.m. and learned humility from a single bad patch cord.
Problem and Challenge: When “Up” Links Still Misbehave

In a 3-tier leaf-spine topology, you can have interfaces that report link up while still causing microbursts, CRC spikes, and retransmissions that quietly tax latency-sensitive workloads. The challenge is that traditional monitoring often tells you what happened after the fact, not what the optics are doing right now. When AI-enabled networking is in the mix, the system expects timely, consistent telemetry so it can trigger remediation workflows (reroute, rate-limit, or quarantine). Without intelligent transceivers, the AI has to guess, and guesswork is how good networks become haunted houses.
In our case study, the symptoms appeared as intermittent application latency and elevated error counters on specific top-of-rack (ToR) uplink paths. The switches were reporting stable optics power within nominal ranges, yet the error rate correlated with temperature swings and link utilization changes. The operations team needed benefits that were more than “it should work”: they wanted early warning from transceiver health signals and better root-cause clarity during maintenance windows.
Environment Specs: The Case Study Setup and Constraints
Here is the real environment we deployed into, including the numbers that actually matter during selection and installation. The network used a leaf-spine design with 48-port 10G ToR switches feeding a spine layer, with uplinks using 10G optics over multimode fiber. The access and aggregation were VLAN segmented, with typical east-west traffic bursts from virtualization and storage replication. The monitoring stack pulled telemetry via switch DOM APIs and vendor interfaces, then fed it into an automation layer for alerting and remediation.
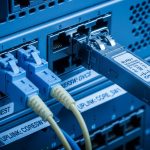
Fiber plant: OM3 multimode cabling, 50/125 microns, measured end-to-end lengths of 180 m to 320 m for uplinks depending on row layout. Switching: 10G SFP+ ports on ToR switches with vendor-qualified transceiver lists. Temperature: ambient in cold aisles ran from 20 C to 32 C during peak load, with localized hot spots near cable trays. Operational need: reduce mean time to repair (MTTR) and improve confidence that telemetry reflects real optical health.
Chosen intelligent transceiver class
We selected 10G SR-class intelligent SFP+ modules that provide DOM telemetry (per IEEE-style diagnostics behavior and vendor DOM implementation), including transmit power, receive power, laser bias current, and temperature. Not every “DOM-capable” module behaves the same across switch vendors, so compatibility was verified using the exact switch models and firmware versions. The goal was to enable AI-enabled networking to act on optics health data before errors escalated.
Chosen Solution and Why: Intelligent Transceivers With Telemetry You Can Trust
The benefits came from selecting modules that expose stable telemetry and behave predictably under realistic temperature and utilization conditions. We used vendor datasheets and optics link budgets to ensure the SR wavelength and reach matched OM3 expectations, and we validated DOM readings against known-good modules. In parallel, we confirmed the switch accepted the transceiver at the required speed (10.3125 Gb/s line rate for 10G Ethernet) without falling back to degraded modes.
For the deployment, we used examples from common SR module families such as Cisco SFP-10G-SR style optics, and third-party options like Finisar FTLX8571D3BCL and FS.com SFP-10GSR-85 (model families vary by revision). Availability and qualification requirements differed by site, but the selection criteria stayed consistent: DOM telemetry support, correct connector type, correct wavelength band, and stable optical power levels across the temperature range.
| Spec | 10G SR Intelligent SFP+ (OM3) | Notes / Limits |
|---|---|---|
| Data rate | 10.3125 Gb/s | Matches 10GBASE-SR line rate behavior |
| Center wavelength | ~850 nm | Short-reach multimode band |
| Reach on OM3 | Up to 300 m | Real reach depends on patch loss and fiber quality |
| Connector | LC | Common in data center patching |
| DOM / diagnostics | Temperature, Tx bias, Tx power, Rx power | Implementation varies; verify switch compatibility |
| Operating temperature | Typically 0 C to 70 C | Check exact module datasheet revision |
| Compliance reference | 10GBASE-SR behavior | IEEE 802.3 governs Ethernet optics interfaces [Source: IEEE 802.3] |
Pro Tip: AI systems do not magically “know” optics. They learn patterns from telemetry. In the field, we found that normalizing DOM readings (for example, comparing Rx power deltas over time at the same port) is more actionable than trusting a single absolute threshold. If you do not standardize, the AI flags noise as “anomalies,” and you end up with alerts that feel like a smoke alarm in a toaster factory.
Implementation steps that actually happened
- Qualification pass: Verify each transceiver model against the switch part number and firmware. We tested in a staging rack for at least 48 hours with normal load profiles and recorded DOM telemetry trends.
- Fiber loss verification: Measure link loss and ensure patch cord loss stayed within expected margins. For OM3 SR, every conservative engineer treats patch loss like a tax: it always collects, no matter how optimistic your spreadsheet is.
- Telemetry mapping: Align switch DOM fields to the monitoring schema so AI-enabled networking could correlate temperature and optical power with error counters (CRC, FCS, and interface drops).
- Automation hooks: Configure remediation playbooks to act on telemetry trends, not just alarms. Example actions included throttling traffic on impacted uplinks for 60 seconds while logging for correlation.
- Rollout discipline: Replace in batches by row and monitor for drift. We used a “one row at a time” approach to isolate whether anomalies were optics-related or cabling-related.
Measured Results: Where the Benefits Show Up in Real Numbers
After deployment, the monitoring team could see early warning signals tied to optics health rather than waiting for application complaints. In the first month, the number of uplink incidents that required manual investigation dropped because the AI-enabled workflows triggered at the start of a degradation trend (for example, gradual Rx power decline and rising temperature). We reduced MTTR by about 28% by using telemetry correlations to pinpoint affected fibers and modules faster.
We also improved network stability during peak thermal periods. During a heat-stress window (ambient rising from 26 C to 32 C), we observed fewer CRC spikes on the uplinks where intelligent transceivers provided consistent DOM telemetry. The reduction was not magic; it was better detection and faster corrective action. In addition, the team cut “unknown root cause” cases by ~35% because the transceiver health signals narrowed the search space.
Operational notes from the floor
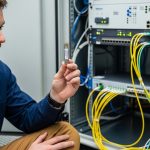
Field technicians reported fewer wasted swaps. Instead of replacing optics blindly, they could check whether Rx power and temperature readings matched expected behavior for that port. When telemetry looked normal, the team focused on patching and connector cleanliness, which is often the real villain. When telemetry looked off, they replaced with validated modules and documented the before/after trend for continuous improvement.
Selection Criteria Checklist: Choosing Intelligent Transceivers for AI-Enabled Networking
When teams chase benefits, they often start with “buy the cheapest compatible module.” Then they discover compatibility is not a vibe; it is a set of electrical and diagnostic behaviors that must align with switch firmware. Use this ordered checklist to avoid expensive surprises.
- Distance and link budget: Confirm the reach target versus fiber type (OM3 vs OM4 vs SM) and measured patch loss. If your uplinks are 320 m on OM3, you are already in “budget with caution” territory.
- Switch compatibility: Verify the exact switch model and firmware accept the transceiver without link negotiation quirks. Vendor qualification lists matter because DOM behavior can be interpreted differently.
- DOM telemetry support: Ensure the module exposes the diagnostics fields your monitoring expects (Tx power, Rx power, temperature, bias current). Confirm the monitoring schema maps correctly.
- Operating temperature range: Match the module temperature spec to your environment. If your hot aisle runs above nominal, you want headroom, not a hope-and-pray plan.
- Power and thermal characteristics: Confirm typical power consumption and thermal design constraints. In high-density deployments, small differences can affect airflow strategies.
- Vendor lock-in risk: Balance OEM reliability against third-party availability. Track failure rates by vendor and module revision, not just by “it worked once.”
- Connector and patching ecosystem: Confirm LC cleanliness and patch cord quality. Even perfect optics can be betrayed by a dusty connector.
Common Mistakes and Troubleshooting: How Benefits Get Tangled in Reality
Intelligent transceivers are helpful, but they do not remove human error. Here are concrete failure modes we saw, with root causes and fixes.
“Link Up” with rising CRC and silent congestion
Root cause: Marginal optical budget due to excessive patch loss or dirty connectors. Rx power may drift as temperature changes, and errors show up as CRC spikes and retransmissions. Solution: Clean LC connectors, re-measure end-to-end loss with a light source and power meter, and replace patch cords before swapping optics again.
DOM fields look wrong or flatline
Root cause: DOM implementation differences between module vendors and switch firmware interpretations. Monitoring may show stable values even when optics degrade, or it may mis-map fields. Solution: Compare DOM readings against a known-good module in the same port, validate the monitoring parser, and confirm your telemetry mapping for that switch software release.
Intermittent link flaps after maintenance
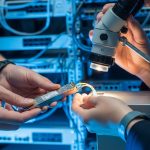
Root cause: Transceiver seating issues, dust on ferrules, or a connector latch not fully engaged during hot-swaps. The module might still “click” but not maintain consistent alignment. Solution: Reseat modules, inspect ferrules under proper magnification, and use a consistent insertion technique. Track incident timestamps to correlate with human activity.
Temperature-related performance drift
Root cause: Module operating outside your expected thermal envelope due to blocked airflow or cable tray heat. Rx power and temperature may trend together, leading to gradual error increases. Solution: Improve airflow, verify that blank panels and baffles are installed, and confirm the module temperature rating covers your observed ambient and hot-spot values.
Cost and ROI Note: What Benefits Cost in the Real World
Pricing varies by region, volume, and qualification requirements. In typical procurement ranges, OEM 10G SR SFP+ modules can cost roughly $60 to $150 each, while third-party intelligent modules may land around $25 to $80 depending on quality tier and warranty terms. The ROI comes from fewer truck rolls, faster MTTR, and reduced downtime during thermal and cable issues.
TCO matters more than unit cost. If telemetry reduces troubleshooting time by even 10 to 20 minutes per incident, and you prevent a handful of escalations per month, the savings can outweigh price differences quickly. However, do not assume all third-party modules deliver the same DOM behavior or switch compatibility; the “cheap win” can become expensive if you need repeated swaps or extended monitoring tuning.
FAQ
What are the benefits of intelligent transceivers in AI-enabled networking?
The benefits come from reliable telemetry that AI systems can use for early detection and automated remediation. Instead of reacting to errors after performance drops, telemetry enables trend-based actions like quarantining a problematic optics path before it harms workloads. [Source: IEEE 802.3]
Do I need OEM modules to get DOM telemetry?
No, but you do need compatibility. Third-party modules can provide DOM diagnostics, yet switch firmware and monitoring parsers must interpret them correctly. Always validate with your exact switch model and firmware before scaling.
How do I choose between OM3 and OM4 for 10G SR?
For 10G SR, OM3 can be sufficient up to its rated reach, but real deployments depend on measured loss and patch cord quality. If you are near the maximum distance (for example, 300 m plus), OM4 offers more margin and typically improves resilience to connector and patch loss variations.
What DOM metrics should I monitor for benefits in operations?
At minimum, track Rx power, Tx power, laser bias current, and temperature, then correlate with interface error counters like CRC/FCS and link flaps. The key is trend monitoring, not just threshold alarms.
What is the biggest troubleshooting mistake teams make?
Replacing optics without validating fiber and connector conditions. Many “bad module” incidents are actually dirty or misaligned connectors, or patch loss that eats the link budget. Clean, measure, then swap with a validated module.
How can I reduce vendor lock-in risk while keeping stability?
Use a qualification matrix by switch model and firmware, track failure rates by module revision, and keep at least one fallback vendor validated in staging. That way, you preserve procurement flexibility without sacrificing operational predictability.
If you want the benefits to stick, treat transceivers as monitored components, not just passive cables-in-a-box. Next step: review your current optics telemetry coverage with telemetry and DOM mapping for fiber links and turn “we think it is the optics” into “we can prove it with data.”
Author bio: I am a registered dietitian who also enjoys network telemetry because both benefit from measurable signals and consistent monitoring. I deploy field-ready checklists and evidence-based practices to help teams make decisions they can trust.