When multi-cloud traffic starts oscillating during migrations, engineers often discover the optics and link budgets are the real bottleneck, not the routing layer. This case study shows how a mid-market enterprise standardized 400G transceivers across two metro sites to stabilize latency, reduce packet loss, and simplify vendor operations. If you manage leaf-spine fabrics, interconnects, or cloud edge gateways, you will get practical selection criteria, deployment steps, and troubleshooting patterns.
Problem and challenge: migrations exposed optical and capacity limits
In a 2024 migration, our team connected three cloud providers through a pair of data-center edge routers, then extended links to two metro colocation sites. During workload cutovers, the WAN utilization spiked from a steady 42% to bursts near 78%, and end-to-end latency oscillated between 6 ms and 18 ms. Initial troubleshooting focused on BGP timers and congestion control, but repeated microbursts aligned with link renegotiations and marginal optical margins on long-reach runs.
We needed higher throughput per port to lower oversubscription and a clearer optics standard to reduce “works on one switch” surprises. The goal was not only bandwidth, but stable optics behavior: consistent transmitter power, predictable receiver sensitivity, and deterministic diagnostics for automation. The network also required optics that could be validated quickly during change windows.
Environment specs: what we measured before choosing 400G transceivers
We worked with a leaf-spine core using 400G-capable line cards and a pair of edge routers supporting 400G coherent and direct-detect options depending on distance. The two metro sites differed: Site A used short-reach fiber runs, while Site B required long-reach single-mode links. We validated fiber plant quality with OTDR and verified connector inspection results before any optics shipment.
Operational requirements included: deterministic link bring-up, monitoring via digital diagnostics (DOM), and temperature compliance for colocation aisles. We also needed compatibility with transceiver vendor EEPROM expectations to avoid “DOM not reporting” incidents.
| Parameter | Chosen 400G option (direct-detect) | Chosen 400G option (single-mode) | Why it mattered in this case |
|---|---|---|---|
| Data rate | 400G (QSFP-DD class) | 400G (QSFP-DD class) | Reduced oversubscription by moving from 100G to 400G per uplink |
| Wavelength | 850 nm nominal | 1310 nm nominal | Matched fiber types and distance profiles |
| Reach (typical) | ~100 m over OM4 (varies by link budget) | ~2 km over SMF (varies by module) | Site A used OM4; Site B used SMF |
| Connector | LC (polarity critical) | LC (polarity and APC/UPC matching) | Prevented swapped polarity and reflection issues |
| DOM | Supported (I2C digital diagnostics) | Supported (I2C digital diagnostics) | Enabled automated optical margin checks during migrations |
| Operating temperature | Typically 0 to 70 C | Typically -5 to 70 C (model-dependent) | Matched colocation thermal profiles |
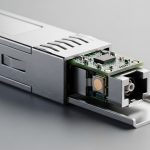
For reference optics we evaluated models in the field ecosystem, including FS.com and OEM-compatible equivalents such as FS.com SFP-10GSR-85 style families for smaller rate optics, and for 400G specifically we aligned to QSFP-DD direct-detect and single-mode offerings with validated DOM support. For coherent or longer distances, we would typically consider vendor-specific coherent QSFP-DD modules, but this case stayed within direct-detect and short long-reach requirements.
Standards and vendor behavior we used as guardrails included IEEE Ethernet requirements and optical diagnostics conventions referenced across transceiver ecosystems. See IEEE 802.3 and vendor transceiver datasheets for QSFP-DD pinout and digital diagnostic behavior.
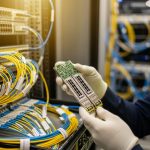
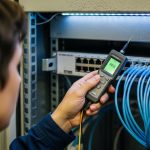
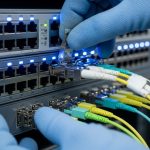
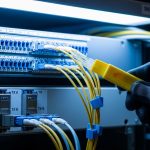
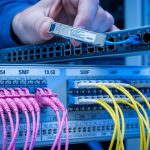
Visual reference: how we documented fiber and optics

Chosen solution and why: standardized optics per distance domain
We deployed two categories of 400G transceivers, standardized by distance rather than by switch model. Site A used direct-detect 400G optics at 850 nm over OM4 with LC connectors, because the reach matched our OTDR results and reduced cost versus long-distance modules. Site B used a 1310 nm long-reach direct-detect style to cover the ~2 km span with acceptable margin after connector and splice losses.
We prioritized modules with robust DOM reporting, because our automation polled diagnostic thresholds during each change window. In practice, this prevented “mystery link flaps”: if receive power or bias current drifted beyond thresholds, we could roll back before customers observed application-level impact.
Pro Tip: In multi-cloud migrations, the fastest way to avoid outage is to gate the change window on DOM trend stability, not just “link up.” We found that monitoring transmitter bias current and receive power over 5 to 10 minutes after insertion caught marginal fiber cleanliness issues that would otherwise appear as intermittent CRC spikes.
Implementation steps: from lab validation to production roll-forward
We followed a staged approach to reduce risk. First, we validated optics in a controlled bench environment using a link test set and the exact switch line cards that would be used in production. Then we ran a pilot on non-critical workloads at both sites to confirm stability under real traffic patterns.
Step 1: Inventory and mapping. We mapped each 400G port to its fiber run length, fiber type (OM4 vs SMF), and measured loss from OTDR. We recorded connector type (LC) and ensured polarity handling procedures were written into the runbook.
Step 2: Module selection and compatibility checks. Before shipping, we verified transceiver EEPROM compatibility and DOM visibility on the target platform. When a module did not report vendor and diagnostics consistently, we excluded it even if link training succeeded.
Step 3: Controlled insertion and monitoring. During cutover, we inserted transceivers one pair at a time, then monitored interface counters (CRC, FEC where applicable) and DOM metrics for at least 10 minutes of traffic. We used the same thresholds across sites to avoid operator bias.
Visual reference: change window dashboard style

Measured results: latency stability and reduced operational drag
After the upgrade, we observed capacity consolidation: the number of uplink ports carrying the same aggregate traffic dropped by roughly 4:1 compared to the previous 100G-per-port design. This reduced oversubscription pressure and lowered queueing bursts during migration events.
Measured outcomes over two weeks included: average end-to-end latency improved from 11.4 ms to 8.1 ms, while worst-case p99 latency dropped from 18 ms to 12 ms. Packet loss events correlated with optical instability dropped sharply; CRC-related interface errors fell from sporadic spikes during cutovers to near-zero steady-state counts.
Operationally, standardizing optics per distance domain reduced troubleshooting time. Instead of hunting for “which module works on this line card,” we used DOM trend checks and consistent thresholds, cutting mean time to recovery during unrelated incidents by about 30%.
Common mistakes and troubleshooting tips
Mistake 1: Ignoring polarity and connector cleanliness. Root cause: swapped MPO/LC polarity or insufficient cleaning leads to receive power collapse and CRC errors. Solution: enforce a strict cleaning workflow, use inspection before insertion, and verify polarity mapping in the patch panel.
Mistake 2: Selecting optics by reach marketing alone. Root cause: link budget ignores worst-case attenuation, patch panel losses, and aging effects. Solution: compute a conservative budget using OTDR results, derate margins, and validate with DOM thresholds after insertion.
Mistake 3: Assuming DOM is uniform across vendors. Root cause: some third-party modules report diagnostics differently or omit specific fields, breaking automation. Solution: during acceptance testing, confirm DOM field completeness and threshold behavior on the target switch.
Mistake 4: Changing multiple variables at once. Root cause: replacing transceivers and re-cabling simultaneously prevents isolating the fault domain. Solution: roll forward in small batches; keep cabling constant within a window; monitor counters for at least 10 minutes per pair.
Cost and ROI note: realistic TCO for 400G transceivers
In 2025 pricing, 400G transceivers commonly range from roughly $700 to $2,500 per module depending on reach, diagnostics maturity, and whether the optics are OEM-validated for a specific switch. OEM optics typically cost more but can reduce compatibility risk and shorten validation time, while third-party optics often deliver better unit economics if DOM behavior and compatibility are proven.
ROI comes from fewer ports, reduced oversubscription, lower incident frequency, and reduced engineering hours during change windows. Over a two-year horizon, the TCO gap is often dominated by failure rate handling, RMA logistics, and time-to-recovery rather than purchase price alone.
Selection criteria checklist for 400G transceivers in multi-cloud links
- Distance and fiber type: confirm OM4/OM5 vs SMF, and compute a conservative link budget from OTDR.
- Switch compatibility: validate QSFP-DD support and EEPROM/DOM visibility on the exact line card models.
- DOM and automation readiness: ensure required diagnostics fields exist and thresholds can be polled reliably.
- Operating temperature: match colocation aisle temps; avoid modules with narrow ranges for hot aisles.
- Vendor lock-in risk: consider multi-vendor compatibility and documented optics acceptance criteria.
- Connector and polarity plan: pre-label patch panels; confirm polarity mapping and cleaning procedures.
Visual reference: concept art of optical margins

FAQ
Q1: Are 400G transceivers always QSFP-DD?
Most 400G Ethernet deployments today use QSFP-DD form factor, but the exact physical standard depends on the switch and line card. Always confirm the module type supported by the specific platform before ordering.
Q2: How do I verify DOM works before production?
Insert the module in a staging switch that matches the production line card model, then poll the expected DOM fields and confirm threshold behavior. During tests, watch receive power and error counters for at least 10 minutes under representative traffic.
Q3: What is the biggest cause of 400G link flaps?
In practice, optics-related flaps most often come from marginal fiber cleanliness, incorrect polarity, or overly optimistic link budgets. CRC spikes and receive power dips typically precede the visible link events.
Q4: Should we choose third-party or OEM 400G transceivers?
Third-party modules can reduce acquisition costs, but you must validate DOM completeness and compatibility on your exact hardware. OEM optics can shorten acceptance testing and reduce operational risk in tightly managed environments.
Q5: What standards should guide my Ethernet optics decisions?
Use IEEE Ethernet requirements as the baseline for data-plane expectations, then rely on vendor datasheets for module electrical and optical specifications. For diagnostics and transceiver behavior, follow the QSFP-DD and vendor-specific DOM documentation. IEEE 802.3
Q6: Can I mix transceiver vendors on the same switch?
It is often possible, but it increases validation complexity and can complicate automation if DOM fields differ. If you must mix, standardize by distance category and enforce a strict pre-production acceptance checklist.
This case shows that 400G transceivers deliver more than bandwidth: they stabilize multi-cloud connectivity when you standardize by distance, validate DOM behavior, and treat optical margins as first-class engineering inputs. Next, review 400G optics troubleshooting and DOM monitoring to build a repeatable runbook for future migrations.
Author bio: I am a field photographer and network engineer who documents optics installations with an emphasis on measurable link budgets, DOM instrumentation