Buying 400G optics is rarely a simple “capex vs capex” choice. In leaf spine data centers and high performance campus backbones, the wrong transceiver mix can trigger rework, port changes, and downtime that quietly erodes ROI. This article helps network and infrastructure leaders model ROI for transceiver investments using measurable inputs: reach, power, compatibility, failure rates, and lifecycle risk. You will also get a step-by-step implementation plan, troubleshooting for common failure points, and an engineer style selection checklist.

Prerequisites: the data you need before you price transceiver investments
Before you model ROI, gather the same inputs your vendor and facilities teams will later audit. If you skip this, your ROI model will drift from reality once you include spares, labor, and power. For IEEE 802.3 adoption planning, anchor your assumptions to the physical layer types your switches support (for example, 400GBASE-SR8 over multimode fiber or 400GBASE-FR4 over single mode) per [Source: IEEE 802.3]. Also pull the transceiver datasheets for operating temperature, optical power budgets, and DOM features; vendors publish these values for compliance and interoperability.
Inventory current ports, optics type, and expected migration path
List each target link in a spreadsheet: switch model, port speed, optics form factor, and planned wavelength type. In a typical 3-tier leaf spine fabric, you might replace 8x100G with 1x400G to reduce switch port count, but the optics must match the switch vendor’s supported transceiver list. Capture current utilization and expected growth for at least 24 months. Then map each link to a reach class and fiber type, because ROI changes dramatically between SR8 and FR4 in both optics cost and fiber plant spend.
Expected outcome: a link-by-link migration table with form factor (QSFP-DD or OSFP depending on platform), fiber type (MMF or SMF), and target standard.
Collect power and thermal numbers you can actually measure
Use two power sources: (1) switch chassis power and (2) transceiver module power. Many transceiver datasheets list typical and maximum module power; use typical for energy cost and maximum for thermal risk buffers. For operational realism, measure actual rack power draw during a representative traffic window using your existing PDUs. If you cannot measure, use switch-level “per port” power estimates from vendor engineering guides, then validate with at least one controlled test link.
Expected outcome: a power model with module watts per link and an energy cost rate (for example, $0.10 per kWh) plus a cooling multiplier (often 1.2 to 1.8 depending on your facility).
Define compatibility and monitoring requirements (DOM, alarms, and support)
Engineers often treat “works in the lab” as “supported in production,” which is where ROI models break. Decide whether you require DOM compliance for monitoring and whether you need vendor-specific optics qualification. DOM usually reports temperature, supply voltage, and optical output bias; ensure your switch firmware supports the DOM thresholds and alarm handling. Also note any vendor lock-in policies: some platforms accept third-party optics but only with reduced monitoring, limited alarm granularity, or without official support.
Expected outcome: a compatibility requirement list that your procurement and operations teams can enforce.
ROI modeling for 400G optics: the math behind transceiver investments
To model ROI, treat each transceiver purchase as a bundle of costs and benefits across three horizons: upfront capex, operating expense (opex), and risk-adjusted downtime cost. Benefits are not only “more bandwidth”; they often include reduced port density, fewer line cards, and lower rack power per delivered bit. Costs include optics purchase price, spares, installation labor, potential truck rolls, and the cost of outages when optics are wrong for the fiber plant. Your model should include both optimistic and conservative scenarios, because optics lead times and failure rates can swing procurement schedules.
Build a cash flow model with capex, opex, and risk buffers
Use a simple discounted cash flow (DCF) structure. For each link group, compute annual energy cost: Energy ($) = links × transceiver_watts × hours_year × energy_rate × cooling_multiplier. Add labor and spares: assume a spares ratio (commonly 1 to 2 per 25 to 50 links depending on criticality and mean time to repair). For risk, estimate an expected outage cost per incident using your incident history (for example, $50k per hour for trading networks, or a lower number for non-critical workloads). Then apply a probability of failure or incompatibility event based on historical RMA rates or your vendor reliability reports.
Expected outcome: a yearly cash flow schedule that includes energy, spares, labor, and expected downtime cost.
Use realistic module examples to parameterize the model
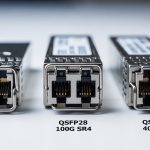
Parameterize with known product families and datasheet values. For 400G over short reach, you will likely see QSFP-DD SR8 modules such as Finisar/FS and other vendors; for example, Finisar optics often appear as part numbers in the FTLX family for 400GBASE-SR8, while FS.com lists widely deployed variants like SFP-DD or QSFP-DD 400G SR8 modules (exact part numbers vary by vendor). For single mode longer reach, look for 400G FR4 or LR4 equivalents and confirm wavelength and reach in the datasheet. When you model, do not use “headline reach” alone: include link budget and connector loss assumptions, and confirm that your transceiver type matches the switch’s supported optics list.
Expected outcome: a model populated with module power (typical/max), reach, and connector type that match your standards and switch platform.

Key specs comparison: what changes ROI most for 400G transceiver investments
ROI is dominated by a handful of optical and operational parameters: wavelength type, reach, module power, connector losses, and temperature range. Even when two modules both say “400G,” they can differ in energy profile and compatibility with your switch firmware. The table below compares common 400G optics categories you will encounter when planning transceiver investments for data centers and campus backbones. Always verify exact values in the module datasheet and your switch vendor compatibility list.
| Optics category | Typical standard | Wavelength / type | Reach (typical) | Connector | Module power (typical range) | Operating temperature | Form factor |
|---|---|---|---|---|---|---|---|
| 400G SR8 | 400GBASE-SR8 | 850 nm multimode | ~70 m on OM4; up to ~100 m on OM5 (varies by vendor) | LC | ~5 to 12 W (check datasheet) | 0 to 70 C or -5 to 70 C (check datasheet) | QSFP-DD |
| 400G FR4 | 400GBASE-FR4 | Single mode WDM | ~2 km to 2.5 km (varies by vendor) | LC | ~6 to 14 W (check datasheet) | 0 to 70 C or -5 to 70 C (check datasheet) | QSFP-DD |
| 400G LR4 | 400GBASE-LR4 | Single mode WDM | ~10 km (varies by vendor) | LC | ~6 to 14 W (check datasheet) | 0 to 70 C or -5 to 70 C (check datasheet) | QSFP-DD |
Important: exact reach and power depend on optical budget, fiber type (OM4 vs OM5), patch panel losses, and connector cleanliness. Use your network’s measured attenuation and patch cord specs, not optimistic “in ideal conditions” values.
Pro Tip: In field deployments, ROI improves most when you model “activation risk,” not just energy. If your switch rejects a third-party optics variant or maps DOM alarms differently, the downtime and labor cost of troubleshooting can exceed the savings from cheaper modules within the first year.
Implementation plan: selecting and deploying optics with ROI controls
Now we turn modeling into action. This is a step-by-step guide you can hand to a field team for a controlled rollout. The goal is to protect ROI by preventing rework, minimizing incompatibility surprises, and ensuring monitoring works on day one.
Run a compatibility pre-check against your switch model and firmware
Confirm the switch model and firmware version, then check the vendor’s optics compatibility list. If you are using Cisco transceivers, for instance, verify that the switch supports the specific module family; Cisco optics often reference part numbers like Cisco SFP-10G-SR for 10G, but for 400G you must use the QSFP-DD family or the platform-specific form factors. For third-party optics, request proof of DOM behavior and alarm mapping from the supplier, and align with the switch’s supported transceiver categories. This step prevents “it links up but telemetry is missing” scenarios that later increase operational cost.
Expected outcome: a short list of optics SKUs that are supported by your switch vendor and firmware.
Choose distance and budget targets using an ordered decision checklist
- Distance and fiber type: validate measured attenuation and connector loss for SR8 vs FR4/LR4.
- Switch compatibility: optics must be on the vendor supported list for your exact model and firmware.
- Reach margin: build a safety margin for patch changes and future cleaning/inspection variances.
- DOM and monitoring requirements: confirm alarm thresholds and whether your NMS reads DOM reliably.
- Operating temperature: ensure the module passes at your rack inlet temperature with airflow constraints.
- Vendor lock-in risk: evaluate third-party supportability and the cost of spares.
- Lead time and supply reliability: model procurement delays and emergency purchase costs.
Expected outcome: a defensible selection that optimizes transceiver investments for both performance and supportability.
Pilot deployment with a measurable acceptance test
Pick one leaf pair and deploy a small batch: for example, 4 to 8 links across varied patch panel paths. Perform a link bring-up test, then validate error counters after a traffic load window. Collect DOM telemetry for temperature, bias current, and receive power where available. Also verify that your monitoring stack (NMS/telemetry) logs alarms with the expected severity. If counters show rising bit errors, stop and inspect fiber cleanliness and patch loss before scaling.
Expected outcome: acceptance evidence that your ROI assumptions hold under real traffic and thermal conditions.

Real-world deployment scenario: where ROI breaks or holds
In a 3-tier data center leaf spine topology with 48-port 10G ToR switches replaced by 12-port 400G spine uplinks, an operator modeled transceiver investments to consolidate ports and reduce line card sprawl. They targeted 320 active 400G links over OM4 with SR8, assuming 20% growth over 18 months. The winning ROI scenario relied on measured patch loss and a strict DOM monitoring requirement: only optics that matched the switch’s DOM alarm mapping were allowed. When one cheaper vendor module failed DOM telemetry in firmware 1.2, the team paused rollout and swapped those optics before scaling, preventing a month of troubleshooting labor and avoiding a potential incident window.
Expected outcome: a controlled rollout where the ROI model remains accurate because compatibility and monitoring were validated early.
Common mistakes and troubleshooting: top failure modes that hit transceiver investments
Even strong ROI models fail when the deployment team runs into known optics pitfalls. Below are three common failure modes with root causes and practical fixes.
Failure mode 1: Link flaps or fails to negotiate
Root cause: incorrect optics type for the switch port (wrong form factor or unsupported standard), or fiber mismatch (MMF vs SMF) and excessive patch loss. Solution: verify the module’s standard and wavelength type against the switch compatibility list, then measure optical power on both ends. Clean connectors using approved procedures, replace suspect patch cords, and confirm fiber polarity where applicable.
Failure mode 2: Monitoring shows “no DOM” or misleading alarms
Root cause: third-party optics DOM behavior not fully supported by your switch firmware, or telemetry polling configured incorrectly. Solution: confirm NMS driver compatibility, validate that the switch firmware reads DOM registers, and compare alarm thresholds against vendor documentation. If DOM is missing, treat it as an operational risk and exclude that optics SKU from bulk deployment.
Failure mode 3: High temperature causes error counters to climb
Root cause: airflow mismatch, blocked intake vents, or operation near module temperature limits. Solution: measure rack inlet temperature and ensure it stays within the module’s rated operating range with margin. Improve airflow paths, reseat modules, and re-check that the switch port faceplate and fan trays are functioning. If errors persist, validate transceiver power draw and optical receive power to rule out marginal link budgets.
Cost and ROI reality check: budgeting beyond sticker price
Typical pricing for 400G optics varies widely by reach and vendor, but in many enterprises you might see SR8 modules priced roughly in the low hundreds to over a thousand dollars each, while longer reach FR4/LR4 can be higher due to WDM optics. OEM pricing usually includes tighter support guarantees and faster replacement logistics, which can reduce downtime risk. Third-party optics can cut purchase cost, but TCO may rise if spares are needed more often, if troubleshooting labor increases, or if compatibility limits telemetry and support coverage. For ROI, model a “support friction factor” based on your team’s historical time spent on optics-related incidents.
Expected outcome: a realistic TCO view where transceiver investments consider energy, labor, spares, and operational risk, not only unit price.
FAQ
How do I model transceiver investments if I do not have measured rack power?
Start with datasheet typical module power and switch-level per-port estimates, then validate with a single measurement window in production. Use that measurement to calibrate your cooling multiplier and energy rate. Your first model should be conservative: include a higher cooling multiplier and assume higher module power at maximum conditions.
Are DOM readings required for ROI, or can I ignore them?
If your operations team relies on telemetry for early failure detection, DOM is a direct driver of risk-adjusted downtime cost. Missing or inconsistent DOM can increase mean time to repair because engineers lose visibility into bias currents or temperature excursions. For ROI, treat DOM reliability as a measurable factor, not a “nice to have.”
What fiber checks matter most for 400G SR8 ROI?
Measured attenuation for the exact patch path is more important than nominal reach. Validate patch cord loss, connector cleanliness, and whether your plant uses OM4 versus OM5 with correct cabling assumptions. A small percentage of “marginal links” can create disproportionate troubleshooting labor.
How do I compare OEM versus third-party optics for transceiver investments?
Compare not only unit price but also warranty terms, RMA turnaround time, and whether switch firmware fully supports DOM alarms. Add a spares and labor model: if third-party optics increase troubleshooting time or require more spares, TCO can exceed OEM. Use your incident history to estimate expected downtime cost.
Which standard references should I align to for 400G planning?
Use IEEE 802.3 for the baseline definitions of 400GBASE-SR8, FR4, and LR4 behavior. Then rely on vendor datasheets and switch compatibility guidance for exact reach, power, and DOM implementation details. This combination prevents “standard-compliant but unsupported” surprises.
When is it worth pausing rollout to validate compatibility?
If pilot links show missing telemetry, unexpected alarm thresholds, or unstable error counters, pause. The cost of swapping modules mid-rollout is often less than the cost of scaling a fleet with hidden monitoring gaps. ROI models should include this decision point as a governance gate.
If you want to extend this approach, the next step is turning your ROI inputs into an optics governance playbook that your procurement and operations teams can reuse. Use transceiver lifecycle ROI governance to standardize acceptance tests, compatibility checks, and spares policies across every migration cycle.
Author bio: I design and commission optics-heavy networks from the rack to the telemetry dashboard, including acceptance testing, DOM validation, and failure mode analysis. My work focuses on measurable operational outcomes so your transceiver investments translate into reliable, supportable bandwidth.