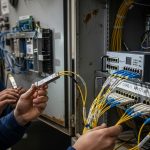
When an optical link drops, the first instinct is to swap hardware. In practice, reliable link failure diagnostics comes from a tight workflow: verify optics and parameters, validate fiber continuity and loss, then confirm module and switch compatibility. This guide helps network engineers and field technicians in data centers and enterprise backbones isolate the fault fast, with measured checks aligned to IEEE 802.3 optical behavior and vendor datasheets. Updated: 2026-05-01.
Prerequisites: tools and standards you must have before testing
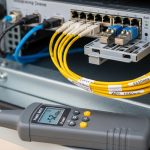
Before you touch the fiber, gather the instruments that actually reduce guesswork. You want repeatable measurements, not “it looks clean” inspections. For optical transport, IEEE 802.3 defines the Ethernet physical layer behavior, while ANSI/TIA-568 and IEC fiber test practices govern how to measure attenuation and continuity. Have these items ready so your link failure diagnostics are evidence-based.
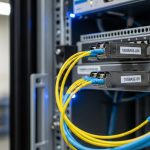
Required field kit
- Optical power meter with wavelength coverage matching the transceiver: typical single-mode wavelengths are 1310 nm and 1550 nm (also 850 nm for many multimode links).
- Optical light source (or a combined OLS/OTDR unit) for end-to-end loss verification.
- OTDR for locating events along single-mode and, when supported, multimode fiber (resolution depends on pulse width and fiber type).
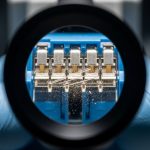
- Microscope or high-magnification inspection scope for connector endfaces; include an angled view for ferrule contamination.
- Clean tools: lint-free wipes, approved cleaning cassette, and compressed air only if your site procedure allows.
- ESD-safe handling supplies and a label kit for port mapping.
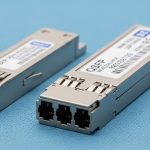
- Transceiver and switch reference: part numbers and datasheets for your optics (example models below).
Expected outcome
At the end of this step, you can measure optical power at both ends, inspect connectors, and map fiber events to a likely fault location. That foundation makes your link failure diagnostics faster and defensible for change control.

Step-by-step implementation: link failure diagnostics workflow for optical links
Use this numbered workflow in sequence. Skipping ahead increases the chance you “fix” the wrong layer.
Confirm symptoms and record link state
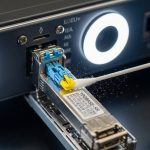
On the switch or router, capture the exact failure mode. Check whether the port shows “link down,” “no signal,” CRC errors, FEC errors, or intermittent flaps. Record interface counters and transceiver diagnostics (DOM) if available. For example, many platforms expose optical receive power, bias current, and temperature via CLI and SNMP.
Expected outcome: You know whether the fault looks like a complete loss of signal, marginal power, or a protocol-level mismatch.
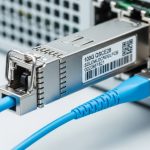
Verify optics type, wavelength, and reach against IEEE 802.3
Confirm the transceiver standard and wavelength match the fiber link budget. For 10G over multimode, common optics use 850 nm and are specified for short reach; for single-mode, 1310 nm or 1550 nm dominate. Check that the switch port supports the module type and speed (for example, 10G SFP+ vs 25G SFP28). If you have exact models, compare to known compatible optics such as Cisco SFP-10G-SR or third-party equivalents like FS.com SFP-10GSR-85. For single-mode 10G SR style optics, use the exact datasheet wavelength and reach figures.
Expected outcome: You eliminate the “wrong optics for the fiber” class of failures before investing time in fiber testing.
Inspect and clean connectors before measuring loss
Connector contamination causes dramatic receive power drops and is a top cause of link failures. Inspect each endface with a scope at appropriate magnification. Clean using approved cassettes; re-inspect until you see no visible residue. If you find a damaged ferrule, replace the patch cord or connector rather than repeatedly cleaning.
Expected outcome: You remove the most common non-permanent fault source, improving the odds that your subsequent measurements reflect fiber reality.
Measure optical power at both ends (end-to-end sanity check)
With the link established (or at least with light transmitted), measure receive power at the far end and transmit power at the near end. Compare to the transceiver DOM thresholds and vendor minimum/maximum. As a practical example, a typical 10G SR multimode link might operate with received power in a range that still supports BER targets; however, exact values depend on the module and optics class. For link failure diagnostics, focus on whether power is far below the module’s designed receiver sensitivity.
Expected outcome: You classify the failure as “no light,” “light present but too weak,” or “likely intermittent.”
Use OTDR or light-source testing to locate events
For single-mode fiber, OTDR can pinpoint splice and connector events by distance. For multimode, OTDR interpretation can be trickier due to modal effects, but it still helps find gross breaks and high-loss sections when configured properly. If you use an optical light source plus meter, verify continuity and measure attenuation end-to-end and per segment.
Expected outcome: You identify the likely damaged span, such as a specific patch panel shelf, a splice enclosure, or a crushed cable section.
Validate DOM readings and module health under load
DOM data often reveals aging optics or marginal bias current. Compare temperature, bias current, transmit power, and receive power to the vendor’s recommended operating region. If the link never comes up, still read DOM to confirm the module is alive and emitting at the expected wavelength. If you suspect incompatibility, test with a known-good transceiver model from the same family.
Expected outcome: You confirm whether the optics are functioning electrically and optically, not just “physically present.”
Confirm switch and cabling configuration
After you restore optical signal, confirm the logical configuration: speed negotiation mode, breakout settings, and any port profiles. Some platforms require specific optics types; others enforce policy-based optics acceptance. If you use 40G or 100G optics (QSFP/QSFP28), ensure the switch port supports the lane mapping and that the fiber polarity is correct.
Expected outcome: The link comes up cleanly and stays stable, with counters showing no excessive errors.
Optics and fiber specs comparison: what you must match to avoid silent failures
Mismatch between transceiver wavelength, fiber type, and reach is a common root cause. Below is a practical comparison of typical module families engineers encounter in the field. Always validate against the exact vendor datasheet and your switch optics compatibility list.
| Module example | Typical wavelength | Fiber type | Target data rate | Connector | Typical reach class | Operating temp |
|---|---|---|---|---|---|---|
| Cisco SFP-10G-SR | 850 nm | OM3/OM4 multimode | 10GBASE-SR | LC | ~300 m on OM3/OM4 class (datasheet dependent) | Commercial/industrial variants (check exact SKU) |
| FS.com SFP-10GSR-85 | 850 nm | OM3/OM4 multimode | 10GBASE-SR | LC | ~300 m class (datasheet dependent) | Varies by product line |
| Finisar FTLX8571D3BCL | 850 nm (850 nm class) | Multimode | 10GBASE-SR | LC | OM3/OM4 class (datasheet dependent) | Varies by revision |
| Generic single-mode 10G SFP+ (commonly 1310/1550) | 1310 nm or 1550 nm | OS2 single-mode | 10GBASE-LR/ER | LC | ~10 km (LR) or up to ~40 km (ER class, model dependent) | Check vendor datasheet |
Expected outcome: You can quickly spot when the optics family cannot physically work with the installed fiber.

Selection criteria checklist: choosing the right optics for stable diagnostics
When you replace optics during link failure diagnostics, choose carefully. The goal is not only “it lights up,” but “it stays within spec across temperature and aging.” Use this ordered checklist.
- Distance and fiber type: confirm OS2 vs OM3 vs OM4, then match reach class to measured attenuation, not nominal distance.
- Wavelength and data rate: ensure the transceiver wavelength matches the fiber’s supported optics and the port’s speed (10G, 25G, 40G, 100G).
- Switch compatibility: verify the transceiver is on the platform’s supported optics list, especially for QSFP/QSFP28 and vendor-validated SFP+ behavior.
- DOM support and thresholds: confirm the module provides DOM and that your switch can interpret it; mismatched DOM can complicate diagnostics.
- Operating temperature range: match the module class to your environment; field failures often occur during HVAC cycling.
- Connector and polarity: ensure LC/SC type and polarity method match the patching standard used in your facility.
- Vendor lock-in risk: evaluate OEM vs third-party for warranty and RMA friction; keep spares from at least two sources when policy allows.
Pro Tip: If the link flaps, do not jump straight to fiber replacement. First compare DOM receive power trend across minutes; a slowly drifting receive level often indicates a connector that is “almost clean” or a micro-crack in a patch cord that only worsens under thermal cycling.
Common pitfalls and troubleshooting tips (top failure modes)
Even with correct steps, field work runs into repeatable failure patterns. Here are the top issues engineers see during link failure diagnostics, with root cause and fixes.
Pitfall 1: “Clean it again” when the ferrule is damaged
Root cause: A scratched or cracked ferrule creates persistent scattering that cleaning cannot remove. You keep measuring low power and chasing phantom attenuation.
Solution: Replace the patch cord or re-terminate the connector. Re-test with power meter and inspection scope after replacement.
Pitfall 2: Wrong transceiver type for the fiber (multimode vs single-mode)
Root cause: A single-mode optic on multimode fiber or vice versa can produce weak or unstable signal due to modal dispersion and incorrect launch conditions.
Solution: Verify fiber type in the tray label and by connector inspection and test records, then confirm the optics wavelength and reach against its datasheet. Use a known-good module family for the same standard.
Pitfall 3: Lane polarity or breakout mismatch on high-speed ports
Root cause: For 40G and 100G optics, incorrect polarity mapping or wrong breakout mode can prevent link establishment even when “light is present.”
Solution: Confirm the port profile and lane mapping in the switch configuration. Then verify patch cord polarity and lane order using facility standards (and re-patch if required).
Pitfall 4: Interpreting OTDR traces with wrong fiber assumptions
Root cause: OTDR settings like pulse width and fiber type model change the trace. Misinterpreting the scale can point you to the wrong section.
Solution: Use correct fiber type settings, then correlate OTDR events with splice locations and patch panel records.
Cost and ROI note: how to control total cost during repeated failures
In many enterprises, optical components are a small line item compared to downtime and labor. OEM optics commonly cost 2x to 4x third-party equivalents, but they may reduce RMA cycles and improve compatibility confidence. Third-party optics can be cost-effective, but plan for validation time: expect 0.5 to 2 hours per replacement for inspection, power checks, and DOM verification. TCO is dominated by spares strategy, failure rates, and whether your team can isolate issues quickly with meters and scopes rather than swapping blindly.
FAQ: link failure diagnostics questions engineers ask before swapping optics
How do I tell if it is a fiber fault or a transceiver fault?
Measure optical power at both ends and inspect connector endfaces. If the near-end transmit power is normal but far-end receive power is near zero, suspect fiber break, polarity, or a major attenuation event. If DOM shows the module is not emitting or has abnormal bias/temperature, test with a known-good transceiver.
What measurements matter most during link failure diagnostics?
Start with receive power and connector cleanliness, then verify attenuation with a light source and power meter or OTDR for location. DOM values help you interpret whether the module is operating within its designed ranges. IEEE 802.3 behavior explains how the PHY reacts to loss of signal, but your meters confirm the optical reality.
Should I rely on switch alarms alone?
No. Alarms indicate symptoms, not cause. A port can report link down due to power being slightly below receiver sensitivity, connector contamination, or lane polarity mismatch. Field measurements and inspection reduce time-to-repair.
Can third-party SFP or QSFP modules complicate diagnostics?
They can, especially if DOM interpretation differs or if the switch enforces strict optics compatibility. Validate the module family against the platform’s supported optics list and confirm DOM fields populate normally. Keep OEM spares if your environment is strict and change windows are short.
What is the fastest way to localize a break?
Use OTDR for single-mode to pinpoint distance to events, then cross-check with splice and patch panel maps. For multimode, combine continuity checks with power measurements and use OTDR if your tool supports the correct fiber model. After localization, re-terminate or replace only the affected span.
Where can I find authoritative standards for optical Ethernet behavior?
Use IEEE 802.3 for PHY requirements and link behavior. For fiber cabling practices and test methods, consult ANSI/TIA-568 and relevant IEC fiber test guidance. Also rely on vendor transceiver datasheets for DOM thresholds and absolute power limits. IEEE standards browser TIA standards portal
Field-ready link failure diagnostics is a discipline: verify specs and cleanliness, measure optical power, then locate loss with OTDR or light-source testing. Next, build a repeatable inventory of optics and fiber characteristics using optical link budget and loss calculation.
Author bio: I deploy and troubleshoot optical Ethernet in production data centers and enterprise backbones, using power meters, OTDR, and DOM telemetry to cut mean time to repair. I write from hands-on work with real transceiver models and switch compatibility constraints in the field.