When an SFP link flaps or won’t establish at the expected speed, the fastest path to root cause is often an insertion loss test on the fiber path. This article helps field engineers and network ops teams validate end-to-end optical budget using a light source and optical power meter, before blaming transceivers. You will get a top list of practical test items, a comparison table of key specs, and a troubleshooting checklist that maps failures to likely causes.
Top 7 insertion loss test items for SFP installations
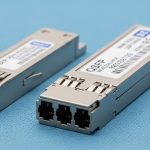
Verify wavelength match to the SFP optical standard
Start by confirming the transceiver type and its nominal wavelength, because an insertion loss test is wavelength-specific. For common SFP optics, you typically test at 850 nm for SR (multimode) and at 1310 nm or 1550 nm for LR/ER (single-mode), depending on the module. If you test at the wrong wavelength, the meter may show misleadingly low or high readings due to fiber attenuation and source spectral content. Use the vendor datasheet for the exact center wavelength and test conditions.
- Best-fit: Mixed environments with SR and LR modules across the same patch panel.
- Pros: Prevents false “fiber is bad” conclusions.
- Cons: Requires discipline in labeling and test setup.
Establish a reference measurement using a calibrated patch lead
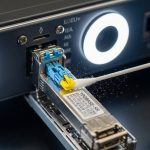
Insertion loss testing relies on a baseline. In practice, you measure a known-good reference path first (for example: meter-to-connector using a short calibrated jumper), then measure the link under test using the same optical interface type (LC vs SC) and geometry. For SFP links, keep connector cleanliness consistent and ensure the launch conditions match the test method. If your test kit supports it, use an adapter set that matches the SFP cage optics and connector keying to avoid micro-gaps.
- Best-fit: Commissioning new racks or after patch changes.
- Pros: Improves repeatability across technicians.
- Cons: Adds time unless you standardize kit contents.
Measure end-to-end loss across the fiber path, not just one jumper
For insertion loss test results to predict SFP link behavior, you must include all contributors: patch cords, splitters (if any), splices, and patch panel interconnects. A common field mistake is testing only “from transceiver to first patch panel,” which can miss additional loss later in the route. Include both directions if the network design uses asymmetric components (rare for passive fiber, but possible with inline devices). Record readings per segment so you can localize loss rather than replace entire assemblies.
- Best-fit: Leaf-spine data centers with dense patching and frequent moves.
- Pros: Produces actionable localization data.
- Cons: More measurements, more logging discipline.
Compare measured loss to optical budget and receiver sensitivity
After you measure insertion loss, compare it to the optical budget and receiver sensitivity for the specific SFP speed and reach. The key is to translate “dB loss” into “link margin.” For example, if the SFP datasheet lists a total allowable budget and your measured insertion loss is close to that limit, the link may be marginal under temperature swings or aging. Consult IEEE and vendor specs for the module’s operating range and minimum sensitivity assumptions. [Source: IEEE 802.3-2022] and [Source: vendor transceiver datasheets]
- Best-fit: Troubleshooting marginal links that connect sometimes.
- Pros: Converts test data into a go/no-go decision.
- Cons: Budget assumptions vary by vendor and test methodology.
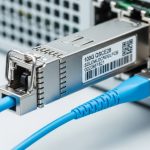
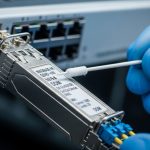
Use a correct connector strategy and cleanliness standard
Connector contamination can dominate insertion loss test outcomes. Before any optical measurement, inspect ferrules with a microscope/inspection scope and clean using lint-free wipes and approved cleaning tools. If you reuse patch cords, verify they are not scratched or worn, since micro-damage can add unpredictable dB loss. Keep in mind that some SFP modules have tighter optical receiver tolerances; a “barely acceptable” connector can still cause intermittent link failures.
- Best-fit: Environments with high truck rolls or frequent patching.
- Pros: Often fixes problems without replacing optics.
- Cons: Adds procedural steps to the workflow.
Account for test equipment specs: uncertainty, power range, and stability
Your light source and power meter have limits that directly affect test validity. Ensure the meter’s wavelength accuracy and uncertainty are appropriate for your target (for instance, stable readings within a tight tolerance at the chosen nm setting). Also confirm that the light source output stays within the safe input range for your meter and that you allow stabilization time before recording. For repeatability, use consistent averaging and document the measurement conditions.
- Best-fit: Multi-site operations needing consistent thresholds.
- Pros: Reduces “operator-to-operator variance.”
- Cons: Requires training and standard operating procedures.
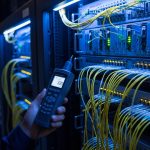
Document results with segment-level notes for faster remediation
Field teams win time by logging where loss occurs. Capture: wavelength, reference method, fiber type (OM3/OM4 MMF vs OS2 SMF), connector types (LC/SC), segment endpoints, and measured dB values per hop. If you later replace a patch cord, you can prove improvement or identify a persistent splice issue. This is especially valuable when SFP modules are swapped during troubleshooting and you need to avoid losing the optical evidence trail.
- Best-fit: Change management, audits, and post-incident reviews.
- Pros: Makes future insertion loss tests faster and more consistent.
- Cons: Requires a simple template and storage discipline.

Key specs comparison: what to test for SFP link validation
To make the insertion loss test actionable, align equipment and test parameters with the SFP link type. The table below summarizes typical wavelengths and connectors for common SFP optical classes and highlights environmental considerations that affect operational confidence.
| Item | Typical SFP class | Test wavelength | Fiber type | Connector | Operating temperature (typical) | Insertion loss relevance |
|---|---|---|---|---|---|---|
| Short reach | 10G SFP SR (examples: Cisco SFP-10G-SR, Finisar FTLX8571D3BCL) | 850 nm | OM3/OM4 multimode | LC | -5 to 70 C (varies by vendor) | Budget is tight; connector and patch cords often dominate |
| Long reach | 10G SFP LR (example: 1310 nm class) | 1310 nm | OS2 single-mode | LC | -5 to 70 C (varies) | Splices and aging can reduce margin over time |
| Extra long reach | 10G SFP ER (example: 1550 nm class) | 1550 nm | OS2 single-mode | LC | -5 to 70 C (varies) | Test at correct nm to avoid spectral mismatch errors |
For standards context, the physical layer requirements for Ethernet over fiber are defined in IEEE 802.3, while exact link budgets and sensitivity values are typically specified in each transceiver datasheet. [Source: IEEE 802.3-2022] and [Source: Cisco transceiver datasheets] and [Source: Finisar/Fiomera/Amphenol transceiver datasheets]
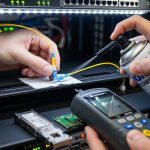
How to run the insertion loss test in the field (repeatable workflow)
In a 3-tier data center leaf-spine topology with 48-port 10G ToR switches, engineers often troubleshoot “link up but no throughput” issues after patch rework. In one real deployment, a team replaced two failing SFPs but found only one side stable; the insertion loss test showed 3.8 dB at 850 nm across a single trunk where the expected budget margin was under 2 dB. By segmenting the route, they traced the loss spike to a contaminated patch cord at the middle row splice tray. After cleaning and replacing that jumper, the SFP negotiated at line rate and remained stable through a weekend traffic soak.
Step-by-step procedure
- Select the correct wavelength on the light source and power meter for the SFP class (850, 1310, or 1550 nm).
- Clean and inspect both ends of the test interfaces; document connector type and adapter used.
- Record a reference measurement using the standardized jumper and adapter set.
- Measure insertion loss segment-by-segment, then sum for end-to-end total.
- Compare total measured loss to the SFP optical budget and confirm remaining margin under expected operating temperature.
Pro Tip: If your insertion loss test is near the allowable budget, treat connector cleanliness as a first-class variable. A single re-clean often yields a measurable improvement of 0.5 to 1.5 dB, which can be the difference between a stable link and intermittent errors—especially on OM3/OM4 SR paths.

Selection criteria checklist: choosing the right test setup and acceptance limits
Even with correct technique, the wrong acceptance threshold can lead to unnecessary transceiver swaps. Use this ordered checklist to standardize decisions across sites.
- Distance and fiber type: Confirm OM3/OM4 vs OS2 and the expected reach class.
- Wavelength and mode: Match the test wavelength to the SFP optical standard; validate launch assumptions.
- Switch and transceiver compatibility: Check platform optics support lists and DOM behavior requirements.
- DOM support and diagnostics: Prefer transceivers with reliable diagnostics if you plan to correlate optical power trends.
- Operating temperature: Ensure the transceiver and planned test environment align with vendor specs.
- Vendor lock-in risk: If you use third-party optics, confirm compliance with the same optical budget assumptions and connector standards.
Common mistakes and troubleshooting tips for insertion loss test failures
When insertion loss test results contradict field behavior, the cause is often procedural rather than optical. Below are common failure modes with practical fixes.
-
Mistake: Testing at the wrong wavelength.
Root cause: Spectral mismatch between light source setting and fiber attenuation profile.
Solution: Re-run at the SFP’s nominal wavelength (850 nm for SR, 1310/1550 nm for LR/ER) and document settings. -
Mistake: Measuring only one jumper or only one direction.
Root cause: Patch panel and splice trays add unmeasured loss.
Solution: Break the route into segments and sum end-to-end; keep endpoint labels consistent. -
Mistake: Skipping connector inspection and cleaning.
Root cause: Ferrule contamination adds excess loss and causes intermittent link negotiation failures.
Solution: Inspect with a scope, clean with approved tools, and re-test immediately before replacing optics. -
Mistake: Using mismatched adapters or damaged patch cords.
Root cause: Adapter geometry or worn ferrules create micro-gaps and extra dB loss.
Solution: Standardize adapter kits; retire cords with scratches or high baseline loss.