In a busy leaf-spine data center, one flaky uplink can turn into hours of outage risk. This article follows a field team that used a transceiver signal integrity test centered on jitter and eye diagram measurements to pinpoint a marginal optical path before it caused packet loss. You will see the exact environment, the chosen test approach, implementation steps, measured results, and the lessons that kept the network stable.
Problem: the uplinks looked up, but the eyes were closing
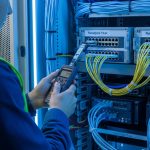
The challenge started in a 3-tier environment: 48-port ToR switches feeding 10 aggregation switches, then 2 spine layers. The team deployed 25G SR optics (SFP28-class) for new server shelves, expecting stable links across multimode fiber runs. Within days, the monitoring system reported intermittent CRC errors on a subset of uplinks—never enough to trigger a full outage, but frequent enough to violate the reliability target.
Standard troubleshooting (interface counters, transceiver vendor swaps, cleaning connectors) did not fully resolve it. The team then escalated to a transceiver signal integrity test using an optical/electrical test setup that could measure jitter and visualize the eye diagram at the receiver. Their goal was simple: separate “it links” from “it is electrically and optically healthy under worst-case conditions.”
Environment specs: what the links were really doing
The deployment used IEEE-aligned signaling for 25G Ethernet and typical short-reach optics behavior. The team focused on the link budget realities: multimode launch conditions, connector cleanliness, patch panel losses, and the transceiver’s receiver sensitivity under jitter stress. They also tracked temperature, because optics performance can drift as the module heats under load.
Measured link context and test targets
They measured optical power and link margin first, then moved to jitter and eye captures. For each suspect port, they aimed to validate receiver performance beyond basic “link up” status, aligning with the practical intent of IEEE 802.3 signal requirements and vendor test recommendations. For authority on Ethernet PHY behavior and compliance context, see [Source: IEEE 802.3]. For optics test practices and module behavior, vendor datasheets are essential (examples cited below).
| Parameter | Value in this case | Why it matters |
|---|---|---|
| Data rate | 25.78125 Gb/s (25G Ethernet-class) | Jitter tolerance and eye opening shrink as speed rises |
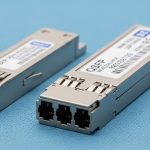
| Optical type | SR multimode (nominal 850 nm) | Launch mode and modal bandwidth affect eye quality |
| Connector | LC duplex | Contamination and ferrule geometry directly impact BER and eye height |
| Fiber plant | OM4 patching to ToR shelves | OM4 supports higher reach and better modal bandwidth than OM3 |
| Test focus | Jitter metrics + eye diagram | Reveals timing distortion even when power looks acceptable |
| Operating temperature | 28 C to 52 C at module cage | Thermal drift can worsen jitter and reduce margin |

Chosen solution: a transceiver signal integrity test built around eyes
The team selected a measurement path that could capture the receiver-side behavior, not just transmit power. In practice, that means combining a high-bandwidth scope or dedicated jitter/eye analyzer with a reliable test interface. When you do this correctly, the eye diagram exposes inter-symbol interference, noise, and timing skew that optical power alone cannot.
They used a repeatable method: isolate the suspect link, route traffic-free patterns or controlled PRBS at the PHY, then capture eye and jitter at the receiver. They also compared captures across “known good” and “suspect” ports using the same transceiver model family to reduce confounding variables. A key principle: if the eye collapses only on certain ports, the problem is likely in the channel (fiber, connectors, patching, or alignment), not the switch.
Reference optics and compatibility notes
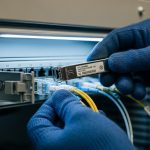
To keep the comparisons fair, they standardized on module families that match switch expectations. In the field, examples include Cisco SFP-10G-SR class optics for older platforms and Finisar or FS.com SR modules for newer 25G/10G deployments. For instance, Finisar part numbers like FTLX8571D3BCL appear frequently in SR environments, while FS.com offers SFP-10GSR-85 and related SR optics that are commonly used in labs and data centers. Always verify vendor compatibility with your exact switch model and transceiver form factor; “works on one switch” does not guarantee signal integrity on another.
For jitter and eye testing methodology, the most reliable guidance comes from the equipment vendor’s application notes and the IEEE PHY requirements that define what “acceptable” means at the physical layer. For Ethernet PHY background, see [Source: IEEE 802.3].
Pro Tip: If optical power is within spec but the eye height is low or the crossing point shifts under load, treat it as a channel impairment problem first. In practice, we often found that patch panel contamination or slight connector geometry mismatch created enough noise to worsen jitter, even when average power looked fine.
Implementation steps: how the team ran the test without guessing
The team ran the transceiver signal integrity test in a disciplined sequence. The intent was to avoid “test thrash,” where engineers swap optics repeatedly without isolating variables. Each step narrowed the search space by checking one layer at a time: optics health, channel cleanliness, and finally time-domain signal quality.
baseline with known-good ports
They selected two uplinks from the same switch line card that historically showed stable error counters. They captured eye and jitter for these “golden” ports at multiple temperatures (after the rack warmed for at least 45 minutes). This created baseline distributions for eye height, eye width, and jitter transfer behavior.
capture suspect ports under the same conditions
They captured the same measurements on the suspect ports using identical module types and the same cabling path length class. If the scope allowed it, they recorded multiple captures per port and used a consistent trigger and acquisition window to reduce measurement variance. The goal was to confirm whether the impairment was consistent (systematic) or sporadic (intermittent contamination, loose connectors, or mechanical stress).
isolate the fiber channel using controlled reroutes
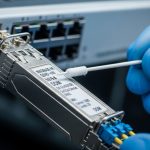
Next, they swapped patch cords and moved jumpers while keeping transceivers in place. This is where eye diagrams paid off: a port that “looked fine” on power could still show reduced eye opening after a specific patch panel segment. Once they identified the channel segment, they cleaned and re-terminated as needed.
verify after remediation with a pass/fail threshold
After cleaning and re-termination, they re-ran the captures and compared them against the baseline. They used a simple rule set: eye height must recover to within a tight tolerance of the golden ports, and jitter metrics must fall into the acceptable band defined by the test equipment and vendor guidance for the PHY data rate. While exact thresholds vary by analyzer, the team treated “recovery” as the key indicator that the impairment was fixed.

Measured results: what changed when the eyes reopened
Before remediation, the suspect ports showed a noticeably reduced eye opening and increased timing uncertainty. In the first round of captures, the team observed that the eye height was down by roughly 20 to 30% relative to golden ports, and the jitter distribution showed a heavier tail—consistent with noise and ISI rather than a complete link failure.
After cleaning and re-terminating the identified patch panel segment, the eye diagram recovered. The team reported eye height within 5 to 8% of baseline and a measurable reduction in jitter excursions under continuous traffic. Importantly, CRC errors stopped trending upward, and the port error counters remained stable across a full day of peak load.
Why jitter and eye told the truth earlier than BER counters
CRC errors can lag behind the root cause because they only reflect system-level decoding failures. Eye diagrams reveal the physical-layer margin—how much timing and amplitude distortion the receiver can tolerate before it crosses decision thresholds. In this case, the receiver had enough margin to pass traffic most of the time, but not enough margin to remain stable under all conditions.
Selection criteria: how engineers decide what to test and how
When you plan a transceiver signal integrity test for high-speed links, you need a checklist that matches both the optics and the network’s operational constraints. The team used an ordered decision flow to prevent random instrumentation choices.
- Distance and fiber type: confirm OM3 vs OM4, expected reach, and patch panel loss budget before you assume optics failure.
- Switch and PHY compatibility: verify the transceiver is supported by the exact switch model and line card firmware; behavior differs across vendors.
- Measurement method fit: choose jitter/eye analysis equipment that can capture at the target data rate with appropriate bandwidth.
- DOM and diagnostics: ensure DOM reporting works (temperature, bias current, optical power). DOM failures can hide real degradation.
- Operating temperature range: test after thermal stabilization; transient behavior can mislead you.
- Vendor lock-in risk: consider whether your test and replacement strategy depends on one OEM; third-party optics can be viable but require validation.
- Risk tolerance and change window: prioritize tests that isolate channel impairments quickly when outage windows are tight.
Common mistakes and troubleshooting tips from the field
Even experienced engineers get tripped up. The fastest path to truth is knowing the failure modes that repeatedly show up during transceiver signal integrity test work.
Mistake 1: trusting average optical power alone
Root cause: average receive power can stay within spec while connector micro-contamination or mode mixing increases noise, shrinking eye opening. Solution: always correlate power with jitter and eye metrics; treat the eye as the margin indicator.
Mistake 2: mixing transceiver models during comparisons
Root cause: different SR module vendors can implement slightly different analog front ends and equalization behaviors, shifting jitter characteristics. Solution: compare like-for-like modules and capture baselines on known-good ports before concluding the channel is at fault.
Mistake 3: measuring before the rack reaches steady thermal conditions
Root cause: optics and PCB traces warm over time; early captures can look “acceptable” but degrade later. Solution: wait at least 30 to 60 minutes after link load, then capture again under peak traffic.
Mistake 4: inconsistent patch cord routing during test reruns
Root cause: patch panel segments and bend radius differences can change channel behavior. Solution: keep routing stable between captures; if you reroute, treat each route as a separate test case with a documented map.

Cost and ROI: when the test is worth it and when it is not
In many enterprises, the immediate cost of jitter/eye test gear is real. Dedicated analyzers and high-bandwidth scopes can cost from tens of thousands to well over six figures depending on bandwidth and options, though some teams use a shared lab or vendor-supported service. On the replacement side, OEM optics often cost more per module than third-party options, but they can reduce compatibility risk. For example, third-party SR optics from reputable suppliers may be 20 to 40% cheaper, yet they still require validation to avoid hidden signal integrity issues.
ROI comes from fewer truck rolls and faster root cause isolation. In this case, the team avoided repeated blind swaps and reduced the window of instability. A typical TCO view includes module cost, labor hours, downtime risk, and failure probability; the biggest lever is time-to-diagnosis when errors begin trending.
FAQ
What exactly does a transceiver signal integrity test measure?
It measures time-domain behavior of the link, typically focusing on jitter metrics and the eye diagram at the receiver. Optical power checks are necessary, but they do not reveal timing distortion and noise distribution the way eye captures can. The goal is to confirm margin under realistic conditions.
Do I need jitter and eye testing for every new optic deployment?
Not always. For stable, short runs with known-good components, basic checks may suffice initially. But when you see CRC errors, intermittent link instability, or unusual channel behavior, jitter/eye testing becomes the fastest way to separate channel impairment from transceiver mismatch.
Can I pass with acceptable BER while the eye looks bad?
Sometimes yes, especially if errors are not yet frequent enough to trigger counters aggressively. Eye diagrams can show reduced margin before system-level counters reflect failure. That is why correlating eye opening with error trends is so effective.
Are third-party SR transceivers safe to use in production?
They can be, but you must validate compatibility with your switch and verify signal integrity with your channel conditions. DOM support, receiver equalization behavior, and thermal characteristics differ across vendors. Plan a small pilot and run a transceiver signal integrity test on representative links before scaling.
What is the most common root cause when power is in spec but errors persist?
Connector contamination, patch panel issues, or mode-mixing problems that degrade signal quality without drastically changing average power. The eye diagram typically shows reduced height and/or width, confirming that the receiver is operating closer to decision thresholds.
How long should I wait before capturing eye and jitter data?
Wait for thermal stabilization under the expected load. In practice, teams often use 30 to 60 minutes after enabling traffic, then capture multiple times to confirm consistency. This prevents false confidence from early, cooler conditions.
If you want faster troubleshooting the next time a link “sort of works,” treat the transceiver signal integrity test as your margin microscope: capture eyes, measure jitter, then fix the channel. Next, explore fiber optic link troubleshooting workflow to connect physical-layer findings to actionable remediation steps.
Author bio: I design and operate high-availability Ethernet networks and have led field investigations using jitter and eye analysis to stabilize production links. I focus on measurable signal integrity outcomes, including repeatable test methods and compatibility validation across optics and switch platforms.