Multi-cloud networking gets expensive fast when transceiver choices create hidden lock-in, spares complexity, and intermittent link instability. This article helps network architects and field engineers perform a practical cost-benefit analysis for transceiver diversity, covering optics specs, switch compatibility, DOM handling, and operational risk. You will get a decision checklist, a realistic deployment scenario, and troubleshooting patterns drawn from hands-on installs. Update date: 2026-05-01.
Why transceiver diversity changes the real cost in multi-cloud
In a multi-cloud environment, your “transceiver cost” is only one line item; the larger cost often comes from integration friction, maintenance delays, and downtime risk. Transceiver diversity can mean mixing vendors and optical types (for example SR vs LR) while keeping the electrical interface standards consistent (10GBASE-SR, 25GBASE-SR, 100GBASE-SR4). The trade-off is that diversity can improve availability and reduce vendor dependency, but it can also increase configuration variance across switches and optics management tooling.
From a field perspective, the key question is not whether diversity is “good,” but whether it reduces total operational effort without increasing failure rates. Engineers often quantify outcomes by measuring mean time to repair (MTTR), optics replacement lead times, and the rate of link flaps caused by compatibility or physical layer issues. A solid cost-benefit analysis will include both purchase price and the downstream operational costs: truck rolls, change windows, and time spent validating DOM telemetry and vendor-specific behaviors.
What “diversity” means in practice
Transceiver diversity usually shows up in one or more of these ways: multiple optical reach SKUs (SR and LR), multiple vendor housings for the same standard, and multiple connector/patch panel ecosystems (LC duplex vs MPO/MTP). Even when the nominal standard matches, vendors can differ in transmitter biasing, receiver sensitivity margins, and how DOM (digital optical monitoring) fields are interpreted. That is why the economic evaluation must account for integration testing and ongoing operational consistency.
Standards and compatibility guardrails
Most deployments anchor on IEEE Ethernet optical standards such as IEEE 802.3 for 10G/25G/100G physical layers, plus vendor platform transceiver support matrices. For optics, the mechanical and electrical expectations often follow SFP/SFP+/QSFP form-factor specs and the relevant optical interface behavior described in vendor datasheets. For DOM, the platform may expect specific I2C access patterns and threshold interpretations; mismatches can cause “DOM unsupported” alarms even when the link is physically working.
For authoritative grounding, review [Source: IEEE 802.3] and vendor transceiver documentation via manufacturer product briefs such as [Source: Cisco Transceiver Documentation] or [Source: Arista Transceiver Compatibility]. For connector and cabling best practices, consult [Source: ANSI/TIA-568] and structured cabling guidance.
Specs that drive the math: reach, wavelength, power, and form factor
To compare options, you need a consistent spec baseline so the cost-benefit analysis is apples-to-apples. Engineers typically compare wavelength, reach, receiver sensitivity, nominal transmit power, and optical budget margins, then map those to your actual fiber plant. Diversity is most beneficial when both options meet the required margin with similar operating conditions and when the switch tolerates them without excessive alarms.
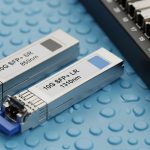
Example transceivers commonly mixed in multi-cloud fabrics
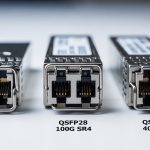
In practice, teams often mix vendor optics that conform to the same optical standard and reach. For example, you might deploy Cisco SFP-10G-SR (10GBASE-SR, 850 nm) or FS.com SFP-10GSR-85 (10GBASE-SR, 850 nm) across different leaf switches, while keeping patch panels and fiber type consistent. For 100G short-reach, you may see QSFP28 SR4 optics such as Finisar FTLX8571D3BCL (100GBASE-SR4, 850 nm) in data center pods.
| Parameter | 10GBASE-SR (SFP/SFP+) | 100GBASE-SR4 (QSFP28) | Notes for cost-benefit analysis |
|---|---|---|---|
| Wavelength | 850 nm | 850 nm | Wavelength matching reduces plant surprises and retest cycles |
| Typical reach | Up to 300 m over OM3/OM4 | Up to 100 m over OM3/OM4 (varies by module) | Short-reach reduces need for long-haul optics and spares cost |
| Connector | LC duplex | MPO/MTP (12-fiber) | MPO handling can increase tech labor time if training is weak |
| Data rate | 10.3125 Gbps (10G Ethernet) | 103.125 Gbps (100G Ethernet) | Match switch port capability to avoid costly rework |
| DOM support | Commonly supported; fields vary by vendor | Commonly supported; fields vary by vendor | DOM mismatch can raise false alarms and drive extra maintenance |
| Operating temperature | Typically 0 to 70 C or extended options | Typically 0 to 70 C or extended options | Hot aisle or edge racks increase derating risk |
Power budget and margin: where diversity can help or hurt
Short-reach optics rely on optical power budgets and receiver sensitivity. When you mix vendors, you want to confirm that both options meet the same minimum receiver sensitivity and transmitter output range under your fiber conditions (OM3 vs OM4, patch loss, and splice count). If one vendor’s module operates closer to the edge of spec due to aging or temperature, diversity may increase the probability of marginal links that flap during peak thermal periods.
Pro Tip: In multi-cloud fabrics, the biggest “hidden cost” of transceiver diversity is not the purchase price difference; it is the time you spend correlating DOM telemetry fields to root cause. Before scaling vendor diversity, validate that both vendors produce consistent DOM thresholds and that your monitoring system interprets them the same way, otherwise you will pay in extra troubleshooting hours.

Real-world cost-benefit analysis scenario in a multi-cloud fabric
Consider a 3-tier data center leaf-spine topology where 48-port 10G ToR switches uplink to a pair of spine switches using 10GBASE-SR optics. Across two cloud providers and one on-prem zone, the team needs about 120 active 10G links per site, plus spares for planned maintenance. They standardize on 850 nm SR over OM4 fiber with LC duplex connectors, using a consistent patch panel layout and labeling scheme.
Originally, the team purchased only OEM optics priced at about $180 per 10G SR module. After a supply constraint, they evaluated third-party compatible optics at about $60 to $90 per module and also introduced a second OEM-compatible vendor to reduce lead time risk. The cost-benefit analysis included: (1) module unit price, (2) 3-year spares inventory cost, (3) expected MTTR impact from availability of spares, and (4) change-window labor hours for qualification.
In a measured rollout, qualifying two vendors took 6 engineer-hours per switch model plus one maintenance window for link validation and DOM monitoring checks. During the next quarter, spare lead time improved from 3 weeks to 3 to 5 days, and the team reported zero additional link flaps after they enforced a strict optical budget policy and verified DOM alarm thresholds. Even if third-party optics had a slightly higher field return rate, the reduced downtime impact and faster replacement often produced a favorable net present value when you include truck-roll avoided cost and reduced change pressure.
Decision checklist: how engineers choose diversity without surprises
The following ordered checklist is how teams typically perform a rigorous cost-benefit analysis for transceiver diversity. Use it as a gate before scaling beyond a pilot group of ports.
- Distance and optical budget margin: confirm fiber type (OM3 vs OM4), patch loss, splice count, and ensure both vendor modules meet receiver sensitivity with comfortable margin.
- Switch compatibility and transceiver support: verify the exact switch model and port type accepts the module without excessive DOM warnings or administrative disable behavior.
- DOM support and monitoring mapping: test that your monitoring stack reads power level, temperature, and alarm thresholds consistently across vendors.
- Operating temperature and airflow: check hot aisle conditions, rack thermal sensors, and module operating ranges; enforce derating rules if needed.
- Budget and spares strategy: model total cost over 3 to 5 years including spares, warranty/RMA logistics, and labor time for replacements.
- Vendor lock-in risk: evaluate lead times, contract terms, and whether a single OEM can supply during peak demand.
- Risk controls for change management: require a pilot, define rollback steps, and document supported optics per switch model.

Common mistakes and troubleshooting patterns
Even when modules are “compatible on paper,” operational issues can appear. Here are concrete pitfalls you can avoid, with root cause and practical solutions.
False DOM alarms causing unnecessary maintenance
Root cause: Your monitoring system expects specific DOM threshold semantics, but the third-party module reports fields with different scaling or units. Engineers then see “high laser bias” or “temperature out of range” alerts even when the link is stable.
Solution: During pilot, compare DOM readings side-by-side under steady conditions and update monitoring thresholds or parsing logic. Also confirm that the switch’s own diagnostic view matches the telemetry you ingest.
Link flaps after hot-swap due to marginal optical power
Root cause: One vendor’s module operates closer to minimum transmit power or receiver sensitivity, and the fiber plant has higher-than-assumed loss (aging patch cords, extra splices, or connector contamination). Thermal swings in the rack push it over the edge.
Solution: Re-measure with an optical power meter and, if available, OTDR on representative links. Enforce a minimum optical margin policy (for example, require a conservative budget headroom) before expanding diversity.
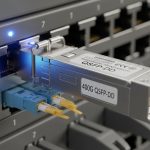
MPO polarity or fiber mapping errors in SR4 deployments
Root cause: 100G SR4 optics use MPO/MTP trunks with strict lane mapping. If polarity is wrong or patch cord type differs between vendors, you can see intermittent errors or link bring-up failures.
Solution: Standardize MPO patch cord polarity method, document lane mapping orientation, and use a polarity test procedure during installation. Keep a small library of known-good patch cords for quick isolation.
Compatibility gaps from unsupported switch firmware behavior
Root cause: Some platforms treat non-OEM optics differently depending on firmware version, including stricter DOM validation logic or different optics temperature alarm handling. Diversity that works on one firmware level may fail after an upgrade.
Solution: Tie optics validation to your change calendar. Before upgrading switch firmware across multi-cloud sites, run a controlled optics qualification test on a staging switch with representative vendor modules.
Cost and ROI: what to budget beyond the module sticker price
A cost-benefit analysis should treat optics as part of an operational system, not a standalone purchase. Typical street pricing (varies by region and volume) often places 10GBASE-SR modules around $60 to $90 for third-party compatible units versus $150 to $250 for OEM-branded equivalents. For 100G SR4 QSFP28, prices are higher and can range widely, so the ROI depends heavily on labor savings and spare availability.
On total cost of ownership (TCO), include: (1) spares inventory carrying cost, (2) RMA and downtime cost, (3) qualification labor hours, and (4) monitoring integration effort. If diversity reduces spare lead time from weeks to days, the avoided downtime can outweigh modest differences in module reliability. However, be honest: if you introduce too many vendors without disciplined testing, you risk higher incident volume and longer incident resolution, which erodes ROI.
When modeling, consider warranty terms and return logistics. OEM optics can simplify RMA paths, while third-party optics may require serial-number matching and more documentation for RMAs. The best ROI generally comes from limited, well-tested diversity: two to three vendors max per platform family and a documented support matrix.
FAQ: transceiver diversity and cost-benefit analysis questions
How do I start a cost-benefit analysis for transceiver diversity?
Start by listing your active optics count and planned spares for 3 to 5 years, then attach unit pricing for each candidate option. Add qualification labor hours, expected RMA cost, and a downtime cost estimate based on your MTTR and change windows. The key output is net savings after accounting for operational risk.
Is DOM support required for a successful diversity rollout?
DOM is strongly recommended because it enables predictive maintenance and faster incident isolation. Some environments can run without DOM alarms, but you will likely spend more time troubleshooting. If you do not have consistent DOM telemetry mapping across vendors, include that integration work in the ROI model.
Can I mix different vendors for the same optical standard safely?
Yes, when both vendors meet the same IEEE Ethernet optical behavior and the switch platform supports the module type. Your success depends on optical budget margin, DOM interpretation, and installation hygiene. Run a pilot on representative links and validate stability under real thermal and load conditions.
What is the biggest risk when adding transceiver diversity?
The biggest risk is hidden incompatibility that shows up as monitoring false positives, intermittent link instability, or firmware-dependent behavior. This is why your checklist includes switch compatibility and DOM validation. Avoid scaling diversity broadly until you have evidence from a controlled pilot.
Should I diversify by reach type, like SR versus LR?
Diversifying by reach can be beneficial when your fiber lengths and budgets vary, but it must be driven by measured distance and margin. Mixing reach types introduces additional operational complexity and cabling variety, so it can be less ROI-positive than limiting diversity to multiple vendors for the same reach. Always confirm connector and polarity standards for the reach type you add.
How many vendors should we include to keep ROI positive?
Most teams keep diversity to two to three vendors per platform family to limit validation overhead. Too many vendors increases monitoring and incident triage complexity, which can reduce the benefits of reduced lock-in. A disciplined support matrix is usually the best balance.
If you want a practical next step, build a small pilot plan using the checklist above and quantify labor and downtime impact in your cost-benefit analysis model. Then document a supported optics matrix per switch model and firmware version, using measured optical margin and validated DOM behavior as the acceptance criteria.
transceiver-selection-best-practices
Expert author bio: I have deployed and troubleshot multi-vendor SFP and QSFP optics in leaf-spine and edge aggregation networks, including DOM telemetry integration and optical budget validation. I write for engineers who need repeatable field procedures, not marketing claims.