If your data center or campus network is running near capacity, optical upgrades can feel urgent and expensive. This article helps network and field engineers run a practical cost analysis that connects transceiver choices, fiber plant constraints, and operational risk to measurable ROI. You will get selection criteria, a spec comparison, troubleshooting patterns from deployments, and a short FAQ for real buyer questions.

Turn optical upgrade spending into a measurable cost analysis
ROI fails when upgrade budgets ignore hidden costs like transceiver compatibility risk, power draw, and the time your team spends troubleshooting marginal links. A useful cost analysis starts with your “installed base” and converts every choice into a line item: optics unit price, expected failure/return rate, spares inventory, and installation labor. In practice, the fastest wins come from aligning transceiver type to IEEE-compliant signaling and your existing fiber reach, then validating with link budgets before you buy.
At a protocol level, most enterprise and data center optics are constrained by IEEE 802.3 physical layer definitions (for example, 10GBASE-SR/ER/LR and 25GBASE-SR/DR). That matters because “it fits the port” is not enough: you must match lane rates, modulation format, and optical budgets to the transceiver and the fiber plant. The vendor datasheet parameters like launch power, receiver sensitivity, and DOM (digital optical monitoring) become inputs to your cost model.
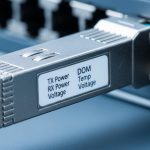
Finally, incorporate operational limits. Many modern pluggables support DOM via I2C, and your switch firmware may enforce thresholds (temperature, bias current, optical power). When thresholds are misaligned, you can see intermittent link flaps that look like “bad optics” but are actually a monitoring or configuration mismatch. That directly affects ROI because downtime becomes an unplanned cost.
Specs that drive both compatibility and cost: SR vs LR vs active options
Engineers often compare optics by headline reach, but ROI is usually determined by the combination of wavelength, reach class, connector style, and power draw. For example, short-reach multimode (SR) optics are typically cheaper and easier to provision in dense racks, but they require the correct fiber type and end-to-end attenuation profile. Long-reach single-mode (LR) can reduce transceiver count and reroutes, but it may increase unit cost and spares complexity.
The table below gives a practical comparison for common upgrade paths. Use it as a starting point, then replace the values with the exact part numbers you are considering (datasheet values vary by vendor and revision). References: IEEE 802.3 definitions and vendor spec sheets.
| Transceiver class (example part) | Data rate | Wavelength | Target reach | Fiber type / connector | Typical DOM | Operating temp | Power note (typ.) |
|---|---|---|---|---|---|---|---|
| SFP+ 10GBASE-SR (Cisco SFP-10G-SR, Finisar FTLX8571D3BCL) | 10G | 850 nm | ~300 m (typ. OM3) | Multimode duplex LC | Yes (common) | 0 to 70 C or -40 to 85 C variant | Usually ~1 W to 2 W class |
| 10GBASE-LR SFP+ (single-mode, LC) | 10G | 1310 nm | ~10 km | Single-mode duplex LC | Yes (common) | 0 to 70 C or -40 to 85 C variant | Often slightly higher than SR |
| SFP28 25GBASE-SR (FS.com SFP-10GSR-85 is 10G; use 25G SR equivalents) | 25G | 850 nm | ~70 m to 100 m depending on OM4/OM5 | Multimode duplex LC | Yes | 0 to 70 C or -40 to 85 C variant | Often ~2 W to 3 W class |
| QSFP28 100GBASE-SR4 (multimode, MTP/MPO) | 100G | 850 nm | ~100 m class on OM4 | Multimode MPO/MTP | Yes (common) | -5 to 70 C or vendor range | Higher aggregate power, but fewer ports |
For your cost analysis, the “reach” value is only meaningful if you can quantify fiber attenuation, connector losses, and patch panel quality. Field engineers typically collect link data using an OTDR (optical time domain reflectometer) for fiber characterization and verify end-to-end loss with a light source and power meter where appropriate. If you are using multimode, confirm OM3 vs OM4 vs OM5, because the modal bandwidth and effective reach assumptions differ.
Pro Tip: Before purchasing optics, measure worst-case link loss across all patch cords and connectors, not just the longest cable run. In real deployments, a small number of “high loss” patch cords can force you into more expensive LR optics than your original plan, even when the average fiber run looks fine in documentation.

ROI-ready decision process: a checklist engineers actually use
To maximize ROI, you need a repeatable selection process that prevents late-stage surprises. Engineers weigh the following factors in order, because they affect both link feasibility and lifecycle cost.
- Distance and reach margin: Validate worst-case attenuation and add a margin for aging and cleaning variability. Use measured loss when possible.
- Data rate and lane compatibility: Confirm the switch port supports the exact standard and speed mode (for example, 10GBASE-SR vs 10GBASE-LR; 25GBASE-SR vs 25GBASE-DR).
- Fiber type and connector ecosystem: Multimode vs single-mode, LC vs MPO/MTP, and whether you have polarity/faceplate constraints.
- DOM support and threshold behavior: Ensure your switch reads DOM correctly (I2C accessibility, alarm thresholds, and whether firmware flags “unsupported” modules).
- Operating temperature and thermal budget: Check the transceiver temperature range and the chassis airflow; in dense racks, poor airflow can trip high temperature limits.
- Vendor lock-in risk: Some platforms enforce DOM calibration or require specific optoelectronic characteristics; third-party optics may work but can trigger warnings that cost time.
- Spare strategy and lead time: If your upgrade is time-critical, the cost of expedited shipping and downtime may exceed unit price differences.
In a fast-moving upgrade, it is tempting to choose based on BOM line item only, but that is rarely the best cost analysis. Instead, compute total cost of ownership for each option: optics purchase price plus installation labor, plus expected support effort (including RMA handling), plus power and cooling impact over the asset life.
How to build a simple TCO model in one spreadsheet
Use a compact model with inputs you can justify with vendor datasheets and measured fiber data. A practical structure is: (1) unit price, (2) quantity of ports, (3) expected replacements over a 3 to 5 year horizon, (4) labor hours per install and per failure event, and (5) downtime cost per incident. Then add power: estimate average transceiver power from datasheet typical values and multiply by hours per year and your power cost per kWh.
Even a lightweight model works if you treat assumptions explicitly. For instance, if you assume a 2% annual RMA rate for a budget third-party optic (based on your own past experience), you will see the ROI quickly shift. That transparency helps you choose confidently rather than “hoping” the optics behave.

Common mistakes and troubleshooting patterns that break ROI
Most optical upgrade disappointments are predictable. Here are frequent failure modes with root cause and practical solutions you can apply quickly. These patterns show up in both vendor optics and third-party modules, so the goal is to reduce uncertainty before rollout.
Link flaps caused by marginal power and dirty connectors
Root cause: Launch power and receiver sensitivity may be within spec, but connector contamination increases insertion loss beyond the budget. In multimode systems, a few bad jumpers can push the link below the receiver threshold during temperature swings.
Solution: Clean and inspect connectors using appropriate inspection tools (microscope inspection is ideal). Replace patch cords with known-good inventory and re-test link stability while watching DOM optical power and temperature alarms. Also verify that the fiber polarity is correct where applicable.
“Works on day one” incompatibility due to DOM alarm thresholds
Root cause: Some optics present DOM values that are numerically valid but outside the switch’s expected ranges. The port may still link up, but the switch logs frequent warnings, or firmware may apply stricter thresholds after a software upgrade.
Solution: Validate with your exact switch model and software release. Check whether the platform expects specific DOM calibration behavior and whether it supports the transceiver class without “unsupported module” flags. If you are doing a software upgrade concurrently, separate the changes to isolate the cause.
Wrong fiber type assumption (OM3 vs OM4 vs OM5) during procurement
Root cause: Documentation often says “multimode,” but the actual plant may mix OM3 and OM4, or patch panels may contain mismatched jumpers. SR reach assumptions differ, so links can fail at higher temperature or during peak utilization due to marginal optical budgets.
Solution: Perform fiber verification: label confirmation, OTDR checks, and attenuation measurements. If you cannot reliably characterize the plant, choose optics with a safer reach class and larger budget margin, even if the unit price is higher.
Thermal overheating in high-density racks
Root cause: Pluggables have operating temperature ranges, but chassis airflow can be insufficient. In dense leaf-spine designs, a blocked vent or failed fan can raise module temperature and trigger link drops.
Solution: Confirm airflow paths and verify that fans and baffles are functioning. Monitor DOM temperature during peak load and after maintenance events. In the cost analysis, include labor for airflow verification because it prevents repeated troubleshooting cycles.
Cost analysis: realistic pricing, TCO drivers, and ROI math
Unit price differences between OEM and third-party optics can look large on purchase day, but the cost analysis needs to include operational and lifecycle costs. As a rule of thumb, OEM pluggables often cost more but can reduce time spent on compatibility validation and support escalations. Third-party optics can be cheaper, yet they can increase the probability of DOM-related warnings, RMA handling, or slower lead times when demand spikes.
Realistic price ranges vary by data rate and reach class, but many teams see patterns like: 10G SR SFP+ modules often land in the mid tens of dollars (OEM) to lower tens (third-party) depending on volume and region; 25G and 100G modules can be several times more per port. Long-reach optics (single-mode LR) typically cost more than SR equivalents, and MPO-based 100G optics can carry additional costs for compatible patching gear.
Power and cooling can also matter in large deployments. If a transceiver averages 2 W to 3 W and you install thousands of ports, that can translate into several kW of additional load. Over a 5-year lifecycle, even small power deltas can influence ROI, especially in facilities with high electricity and cooling costs.
Finally, include spares. A common ROI mistake is buying just enough optics for the deployment timeline. Field teams often prefer to hold a small buffer (for example, 1% to 3% of quantity) so that failures do not halt production waiting on shipments. That spare inventory becomes a controllable cost if you plan it early.
Pro Tip: When comparing OEM vs third-party, run a “support friction” test: deploy a small pilot on your exact switch model and software version for at least two weeks, then count port log warnings and DOM threshold events. The operational time cost can outweigh the unit price savings.
FAQ: cost analysis questions from buyers and field engineers
How do I start a cost analysis if I do not know my exact fiber loss?
Begin with available documentation, then validate quickly. Use OTDR for distance and gross attenuation checks, and test a representative set of links (including the longest and the most connector-dense paths). After that, update the model with measured loss so your ROI assumptions match reality.
Is DOM support required for ROI, or can I ignore it?
DOM is not strictly required for link establishment, but it is required for operational efficiency. If your switch can read DOM, you can predict failures earlier, detect marginal optics, and reduce troubleshooting time. For ROI, that often beats the small unit price savings of modules with limited monitoring.
What is the biggest compatibility risk with third-party optics?
The biggest risk is not whether the link comes up; it is how the platform handles module identification and DOM thresholds. Some platforms log frequent warnings, restrict speed negotiation, or change behavior after firmware updates. A short pilot on the target switch model is the fastest mitigation.
Should I choose SR or LR for cost savings?
SR is often cheaper per port when you have sufficient multimode reach and clean patching. LR can reduce the number of transceivers and eliminate reroutes if your fiber plant is already single-mode with good loss characteristics. The best choice depends on measured link budgets and the cost of any fiber rework.
How many spares should I stock to protect ROI?
A common starting point is 1% to 3% of installed quantity, adjusted for criticality and lead times. If your deployment is time-sensitive or your vendor lead times are long, increase the buffer. Your cost analysis should include the labor cost of downtime during waits, not just the spare module cost.
What are the fastest troubleshooting steps when a link does not come up?
First, verify speed negotiation and that the port is enabled for the correct standard. Next, inspect and clean connectors, then confirm fiber type and polarity where relevant. Finally, compare DOM values (optical power, temperature, and alarm flags) to expected ranges from the datasheet and your switch logs.
If you want the next lever for ROI, focus on deployment discipline: clean patching, measured link budgets, and a pilot that validates DOM behavior on your exact switch firmware. For a related perspective, see optical link budgeting ROI to connect optics specs to real operational outcomes.
Author bio: I have deployed and troubleshot optical transceiver upgrades across multi-vendor switch fleets, using OTDR measurements, DOM telemetry, and port log correlation to cut incident time. I focus on PMF-style validation for infrastructure changes: small pilots, measurable success criteria, and fast iteration until the ROI holds in production.