High latency in optical networks often looks like a “mysterious slowdown,” but in practice it usually traces back to a small set of physical-layer and configuration issues. This guide helps network engineers, NOC leads, and field techs isolate whether the problem is optical power, timing, optics compatibility, or congestion. You will follow a step-by-step workflow with concrete measurements, decision criteria, and troubleshooting actions that map to real deployments.
Prerequisites: what to collect before you touch optics
Before swapping anything, standardize your evidence. Latency symptoms can be caused by optical misalignment, marginal transceiver performance, duplex or MTU issues at higher layers, or oversubscription downstream. If you collect the right data first, you avoid “fixing” the wrong layer and creating new outages.
Confirm scope and capture baseline latency
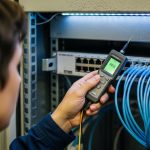
Run latency tests from the affected host or switch to a known target, using at least two paths if your topology allows it. Capture minimum, average, and 99th-percentile latency over a 10 to 30 minute window to catch intermittent issues. If you can, record link utilization and packet drops at the same time, because optical-layer problems sometimes show up as microbursts rather than constant loss.
Expected outcome: You can tell whether latency is localized to one hop, one rack, or multiple paths, and whether loss correlates with latency spikes.
Gather optical telemetry and interface counters
Pull transceiver diagnostics and port counters from the switch. For optics, record received power (RX), transmit power (TX), and module temperature if available via vendor CLI. Also record interface errors: CRC/FCS errors, FEC counters (if present), RX/TX LOS, and any “link flaps.”
Expected outcome: You have a time-synchronized snapshot of optics health and L1/L2 counters, which speeds up root-cause analysis.
Document the exact optical parts and firmware
Write down model numbers and revision details for the optics and the switch. Examples include Cisco Cisco SFP-10G-SR, Finisar FTLX8571D3BCL, or FS.com SFP-10GSR-85 (all SR-class optics but with different DOM behavior and vendor-specific thresholds). Confirm whether the switch supports the module type (SFP, SFP+, QSFP+, QSFP28, OSFP) and whether optics use vendor-specific EEPROM profiles.
Expected outcome: You can quickly spot compatibility gaps such as DOM threshold mismatches or unsupported transceiver EEPROM layouts.
Step-by-step latency isolation for optical networks
Once prerequisites are done, use a strict sequence: verify physical layer health, validate link integrity and coding, then rule out higher-layer congestion. The goal is to determine whether latency is caused by a degrading optical link, a recoding event, a retransmission pattern, or queueing due to oversubscription.
Check link state and physical alarms
Look for LOS (loss of signal), LOF (loss of frame) where supported, and any link-down/up events. Even “brief” flaps can produce latency spikes because routing reconvergence or ARP/ND churn can follow. If you see stable link state but rising errors, you likely have marginal optical power or fiber contamination.
Expected outcome: You confirm whether the latency spikes align with physical-layer alarms or link events.
Measure optical power and compare to transceiver limits
For short-reach multimode links (often 850 nm SR), compare RX power against the optics’ specified receive sensitivity and the vendor’s recommended operating window. For example, 10G SR optics typically operate around 850 nm over OM3/OM4 fiber, with typical reach targets of tens to a few hundred meters depending on optics and fiber grade. If your RX power is near the sensitivity floor, FEC (for higher-speed links) may work harder, increasing processing latency and causing retransmissions at higher layers.
Expected outcome: You identify whether the link is running “marginal,” not outright failed.

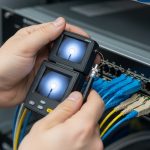
Validate fiber cleanliness and connector geometry
Most “mysterious latency” in optical networks is ultimately caused by fiber contamination, not by the transceiver itself. Inspect and clean connectors using the correct method (fiber inspection scope and approved cleaning media). If you recently re-routed patch panels, check for swapped fibers, damaged ferrules, or bent patch cords that can degrade coupling.
Expected outcome: You eliminate the highest-probability physical-layer cause before replacing expensive optics.
Check coding, FEC mode, and speed/duplex negotiation
For Ethernet over optical, verify the transceiver and switch are using compatible FEC settings where applicable (especially for 25G/50G/100G). Some platforms support multiple FEC modes (or “auto”), and a mismatch can reduce link margin or cause increased error correction activity. Also confirm the interface is locked to the expected speed and that there are no “fallback” events (for example, 100G negotiating down to 40G or 25G).
Expected outcome: You ensure consistent physical-layer coding and avoid recoding events that can inflate tail latency.
Rule out queueing and retransmission patterns
If the optical link looks healthy but latency remains high, examine congestion indicators. On the switch, check egress queue drops, buffer utilization, and tail-drop counters. If you are seeing retransmissions at the transport layer (TCP), correlate timestamps of retransmission with switch drop events. High latency with low drops can be scheduling-related; high latency with drops suggests queue saturation.
Expected outcome: You separate “optical impairment” from “network load” causes.
Optics and link types: key specs that affect latency
Different optical network segments use different wavelengths, connectors, and link budgets. Latency impact is usually indirect: poor optical margin increases errors and retransmissions, while coding and FEC activity can increase processing overhead. Use the comparison table below to align the optics you are troubleshooting with the link type and typical operating conditions.
| Optics / Link Type | Wavelength | Typical Reach | Connector / Media | Power / DOM | Operating Temperature | Latency Sensitivity Notes |
|---|---|---|---|---|---|---|
| 10G SR (SFP+) | 850 nm | ~300 m on OM3, up to ~400 m on OM4 (varies by vendor) | LC, multimode fiber | DOM commonly supported; RX power must stay above sensitivity | Typically around -5 C to 70 C (check datasheet) | Marginal RX can elevate errors, triggering retransmissions |
| 25G SR (SFP28) | 850 nm | ~100 m on OM3, ~150 m on OM4 (varies by vendor) | LC, multimode fiber | DOM supported; tighter budget than 10G SR | Typically -5 C to 70 C | Less margin increases tail latency under stress |
| 10G LR (SFP+) | 1310 nm | ~10 km on single-mode | LC, single-mode fiber | Often DOM; RX budget broader but fiber issues still matter | Typically -5 C to 70 C | Connector contamination can still cause error bursts |

Selection criteria checklist for faster root cause
Engineers often replace optics too quickly. Use this ordered checklist to decide whether the current optics are fit for the job and whether a swap is likely to resolve latency.
- Distance vs link budget: confirm fiber grade (OM3 vs OM4), cable length, and expected attenuation at the wavelength.
- Switch and transceiver compatibility: verify the switch supports the exact form factor and electrical interface (SFP, SFP+, SFP28, QSFP28).
- DOM and threshold behavior: ensure DOM is read correctly and that RX/TX diagnostics are not misleading due to vendor differences.
- Operating temperature and thermal coupling: check if the transceiver temperature is elevated beyond typical normal ranges.
- Vendor lock-in risk: confirm whether the platform enforces compatibility checks or uses vendor-specific EEPROM fields.
- FEC and coding alignment: for higher speeds, confirm the platform’s FEC mode matches the optics and configuration.
- Connector and patch panel hygiene: inspect with a scope; clean before concluding the optics are defective.
Pro Tip: In live troubleshooting, treat DOM RX power as a “margin indicator,” not an absolute truth. If RX is stable but latency spikes coincide with bursts of CRC/FEC corrections, the issue is often fiber contamination that causes intermittent coupling loss rather than a permanently low signal.
Common mistakes and troubleshooting tips
Below are frequent failure modes that produce high latency in optical networks, with root causes and practical fixes.
Mistake: swapping optics without cleaning first
Root cause: Dirty LC connectors or patch cords create intermittent attenuation, which can look like a “bad module” during quick tests. The new optics may still experience the same contamination.
Solution: Inspect every connector with a fiber scope, clean with approved tools, and re-seat firmly. Re-check RX power and error counters after cleaning before any additional swaps.
Mistake: ignoring FEC and speed fallback behavior
Root cause: A mismatch in FEC settings or unexpected speed fallback increases processing and can trigger retransmissions. Latency often rises in the absence of obvious link-down events.
Solution: Verify interface speed is locked to the expected value and review FEC status if your platform exposes it. If auto-negotiation is involved, test with a controlled configuration change and confirm stability over 15 to 30 minutes.
Mistake: trusting “green” link indicators while counters climb
Root cause: Many switches show link up even when the link margin is degraded. You may see no LOS/LOF alarms but still observe rising CRC, FCS, or correction counters.
Solution: Use a counter-driven approach: track CRC/FEC correction deltas over time and correlate them with latency percentiles. If errors increase during latency spikes, focus on optics, fiber, and connector geometry.
Mistake: mixing multimode grades or undocumented patch lengths
Root cause: OM3 vs OM4 differences and patch panel length changes can push the link beyond budget, especially for 25G SR and above. The link may “work” but remain marginal, increasing tail latency under load.
Solution: Validate fiber grade, total channel length (including patch cords), and ensure the optics are rated for that channel budget. If uncertain, measure with an OTDR and confirm splice/connector loss.

Cost and ROI: what to budget for optical network latency fixes
For optics, OEM transceivers often cost more upfront but may reduce compatibility risk in tightly controlled environments. Typical street pricing varies widely by speed and vendor, but a realistic range for common modules is: 10G SR SFP+ often in the tens to low hundreds of dollars, while 25G SFP28 SR and higher-speed optics can be materially more. Third-party optics can be cost-effective, but the ROI depends on whether your platform supports them cleanly and whether DOM readings and thresholds behave as expected.
From a TCO perspective, the biggest cost is usually not the module price but downtime, truck rolls, and repeated incident cycles. If high latency is intermittent, the ROI of fiber cleaning tools, an inspection scope, and disciplined counter-based verification is often higher than repeatedly swapping optics.
FAQ
How do I tell if high latency is optical or congestion?
Correlate latency percentiles with optical indicators like RX power stability, CRC/FEC corrections, and any link flaps. If latency spikes align with error bursts and retransmissions, it is likely optical impairment; if they align with queue drops and high utilization, it is likely congestion.
What RX power values should I target for 850 nm SR links?
Target values depend on the specific transceiver model and datasheet receive sensitivity, because “good” RX power windows vary. Use the vendor’s recommended operating range and ensure RX stays comfortably above sensitivity, not just above a minimal “it links up” threshold.
Can a compatible-looking third-party optic still cause latency issues?
Yes. Even if the link comes up, differences in EEPROM fields, DOM thresholds, or FEC behavior can reduce margin or produce misleading diagnostics. Validate with sustained traffic and error-counter trends, not only link-up status.
Why do latency spikes happen without LOS alarms?
Intermittent fiber contamination can cause short coupling losses that do not trigger sustained LOS alarms but still increase retransmissions. Also, coding and correction events can happen while the link remains “up,” creating tail latency without obvious optical alarms.
Should I clean connectors every time before replacing optics?
In most field environments, yes. Connector contamination is a top cause of degradation, and cleaning is low-cost compared to module replacement and downtime. Clean, inspect, re-seat, then re-check counters and latency after each change.
When is it worth using an OTDR instead of only checking transceivers?
Use OTDR when you suspect unknown patch loss, excessive splice loss, or damaged fiber segments. If your latency correlates with errors but RX power remains puzzling or inconsistent, OTDR can reveal loss events that simple transceiver telemetry cannot explain.
If you follow the counter-driven workflow above, you can usually determine whether high latency in optical networks is caused by marginal optics, contaminated connectors, coding mismatches, or queueing. Next, review fiber-optic-connector-cleaning-best-practices to reduce recurrence by hardening your physical-layer hygiene.
Author bio: I have deployed and troubleshot multi-vendor Ethernet-over-fiber links in data centers, validating optics with DOM telemetry, error counters, and fiber inspection workflows. I focus on measurable diagnostics and safe change management to reduce downtime during latency incidents.