In high-growth telecom and data-center networks, choosing between 400G and 800G optics can swing telecom costs through port density, power draw, optics spend, and outage risk. This reference helps network and procurement teams evaluate transceiver options using practical engineering constraints: reach, wavelength plan, compatibility, DOM behavior, and operating temperature. You will also get a field-ready troubleshooting checklist and a quick decision guide for selecting the lowest total cost of ownership.
Why 800G optics can reduce telecom costs even when unit price is higher
At first glance, 800G modules cost more per transceiver than 400G. But telecom cost models often hinge on how many ports and cards you need to deliver the same capacity, plus the optics and power consumed per delivered bit. In practice, moving from 400G to 800G can reduce transceiver count by roughly half for the same aggregate bandwidth, which typically reduces inventory complexity and spares footprint.
However, the savings are conditional. 800G requires compatible line cards and coherent or optical transport capabilities depending on the interface type (for example, QSFP-DD800 for direct attach and short reach; coherent pluggables for long reach). If your switching fabric or optical subsystem cannot accept the target 800G form factor, your “savings” can vanish into redesign work, schedule delays, and expensive break-fix swaps.
Pro Tip: In field audits, the biggest hidden lever is not the optics price; it is the number of optics you must keep hot in spares. If your 400G design uses 2x modules per service bandwidth, your spares and receiving QA workload double, even if the initial build looks cheaper.
400G vs 800G: specs that directly affect deployment cost
Telecom cost differences show up when engineering constraints force you into higher-cost fiber plant, tighter power budgets, or more frequent maintenance. Before comparing vendors, normalize the comparison by interface standard, wavelength, reach, and optical power class. For short reach over multimode fiber, 400G and 800G often land on different lane counts and optics architectures, which influences power consumption and thermal headroom.
For long-haul and metro applications, the dominant variable is typically coherent optics configuration and dispersion tolerance, not just the gross data rate. Still, the module form factor and monitoring features (DOM) affect operational cost through faster diagnostics and fewer truck rolls.
| Spec | 400G (common short-reach options) | 800G (common short-reach options) |
|---|---|---|
| Typical interface | QSFP-DD 400G class (varies by vendor) | QSFP-DD800 class (varies by vendor) |
| Wavelength | 850 nm (MMF) or per vendor plan | 850 nm (MMF) or per vendor plan |
| Reach (example MMF) | Up to ~100 m on OM4 (vendor-dependent) | Up to ~100 m on OM4 (vendor-dependent) |
| Connector | LC duplex (typical for pluggables) | LC duplex (typical for pluggables) |
| Power (rule-of-thumb) | Often ~5–12 W per module (depends on architecture) | Often ~8–20 W per module (depends on architecture) |
| Operating temp | Commercial to industrial bands; confirm spec | Confirm industrial/extended options if needed |
| Monitoring | DOM via I2C; vendor-specific alarms | DOM via I2C; vendor-specific alarms |
| Compatibility gate | Switch line card support for 400G optics | Line card support for 800G + form factor |
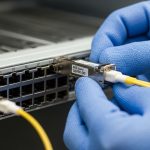
To ground this in real hardware behavior, teams commonly evaluate specific optics SKUs against their switch vendor compatibility list. Example part families include 10G/25G SR optics used for lane-mapped designs (e.g., Cisco SFP-10G-SR) and 10G SR optics from third-party vendors like Finisar FTLX8571D3BCL or FS.com SFP-10GSR-85. Even though those are not 400G/800G modules, they illustrate why DOM and link training behavior can differ across vendors and why “it lights up” is not the same as “it stays stable under load.”
Standards matter too. For Ethernet physical layer behavior at high rates, engineers reference IEEE 802.3 families and vendor platform datasheets for signal integrity and link training requirements. For connector and cabling performance and safety, teams also align with ANSI/TIA cabling guidance and fiber test practices. [Source: IEEE 802.3 Working Group] [Source: ANSI/TIA-568 and fiber cabling guidance] [Source: Vendor transceiver datasheets]

Cost model: the math procurement teams actually use
Telecom costs should be modeled per delivered bandwidth and per service lifecycle, not per module. A practical approach is to compute cost per Tbps of installed capacity and then add operational cost drivers: power, spares, and downtime. For a given rack or site, the number of required line cards and optics directly affects both capex and the schedule risk.
Start with a baseline: assume your network needs 3.2 Tbps of ToR-to-spine transport. With 400G optics, you would provision about 8 ports (3.2/0.4). With 800G optics, you would provision about 4 ports (3.2/0.8), assuming the same interface type and reach. If your platform supports both, the optics count drops roughly 50%, which lowers optics procurement, receiving QA time, and spare inventory.
Where the model can break
800G may require different fan-out optics, different breakout constraints, or different lane mapping that changes the cabling plan. If you cannot reuse existing fiber harnesses, you may need additional patch panels, new MPO-to-LC breakout assemblies, or re-terminations. Those changes can outweigh the module savings quickly.
Also include power. Even if an 800G module draws more watts than a 400G module, the watts per delivered bit can still improve due to higher throughput per slot. Field teams often validate this with measured power at the rack PDU under steady traffic, not only datasheet values.
Finally, factor failure and replacement costs. A module that is slightly more expensive but has better DOM alarm granularity can reduce mean time to repair (MTTR). That reduction matters most when you have tight maintenance windows or when you must dispatch to remote huts.
Selection criteria checklist: choose 400G or 800G without regret
Use this ordered list during requirements and bid evaluation. It is designed to prevent the most expensive mistakes: incompatible optics, insufficient reach margin, and surprise thermal or monitoring behavior.
- Distance and reach margin: confirm link budget for your fiber type (OM3/OM4/OS2), connector losses, and worst-case aging.
- Budget and capex vs opex balance: model optics cost, line card cost, and power cost per Tbps.
- Switch compatibility: verify the exact switch model supports the 400G or 800G form factor and lane mapping. Use vendor compatibility lists.
- DOM and monitoring maturity: confirm DOM returns correct thresholds and that alarms map cleanly into your NMS or telemetry pipeline.
- Operating temperature: pick industrial or extended temperature modules for high-ambient sites; verify airflow assumptions.
- Vendor lock-in risk: compare OEM vs third-party support terms, warranty, and firmware compatibility.
- Spare strategy: plan how many modules you will keep per site and per failure domain to minimize truck rolls.
- Test plan before rollout: run burn-in and BER verification under realistic traffic patterns (including microbursts).

Common pitfalls and troubleshooting tips (field-tested)
Even when optics are “compatible,” link stability and alarm behavior can fail in subtle ways. Below are recurring failure modes and how to fix them quickly.
Link comes up, then flaps under load
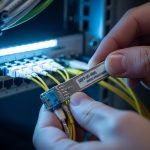
Root cause: marginal optical power, dirty connectors, or insufficient reach margin that becomes visible only at higher burst activity. Solution: clean LC connectors with proper lint-free wipes and inspection scope; re-test with an optical power meter and confirm receive power and transmit power per vendor spec.
DOM alarms are noisy or telemetry is missing
Root cause: DOM threshold format differences, unsupported alarm registers, or firmware/driver mismatch on the host. Solution: validate DOM readings in a staging environment; confirm the switch software version and transceiver compatibility. Align NMS parsing to the vendor’s documented DOM register map.
Temperature-related performance degradation
Root cause: airflow short-circuit, blocked intake vents, or selecting commercial temperature modules for an industrial environment. Solution: measure inlet and module temperature during peak load; upgrade to industrial/extended temperature optics and correct airflow paths.
Wrong fiber type or patch loss mismatch
Root cause: OM4/OM3 mix-ups, degraded patch cords, or unaccounted insertion loss in intermediate harnesses. Solution: pull fiber test reports, verify end-to-end loss and polarity, and standardize patch cords and harness assemblies.
When troubleshooting, follow a consistent order: verify physical cleaning, verify link metrics (optical power, error counters, FEC status if applicable), then verify software and DOM telemetry. This order prevents chasing software issues when the root cause is contamination or loss.
Cost and ROI note: how to compare OEM vs third-party optics
Real-world pricing varies by capacity, vendor tier, and contract terms, but teams should expect meaningful differences. OEM 400G/800G optics often carry premium pricing and include tighter support guarantees, while third-party modules can reduce upfront telecom costs but may require stricter validation and longer acceptance testing.
As a practical planning range, many operators see third-party optics priced at a discount relative to OEM, sometimes in the 10% to 30% band depending on volume, warranty terms, and DOM support. The ROI depends on failure rate, warranty coverage, and how quickly you can replace a module without extended downtime. If your MTTR is high due to spares logistics, the savings from cheaper optics can be erased by higher operational disruption.
For power, consider measured rack draw. If 800G optics improve watts per Tbps, you can see lower energy cost at scale even if each module is slightly higher power. But validate with PDU telemetry because airflow and module placement can change real-world power conversion and thermal behavior. [Source: Vendor transceiver datasheets] [Source: Field energy metering best practices for data centers]

FAQ
How do 800G modules change telecom costs at the rack level?
They can reduce optics count and the number of required switch ports for the same throughput, which lowers capex and spare inventory. The tradeoff is that you may need compatible line cards and potentially new cabling harnesses, which can add integration cost.
Are 400G and 800G interchangeable across telecom switch platforms?
No. Compatibility is platform-specific, including form factor, lane mapping, and supported optical interface types. Always verify against the switch vendor compatibility list and validate with the exact software release you will run.
What reach should we assume for cost planning?
Plan using vendor-published reach for your fiber type and include connector and patch loss margin. For MMF, many deployments target short-reach budgets (often tens to around a hundred meters on OM4), but your harness losses can reduce margin quickly if you reuse older patch cords.
Does DOM support affect operational telecom costs?
Yes. Better DOM alarm granularity and reliable telemetry reduce troubleshooting time and can shorten MTTR. If your NMS cannot interpret DOM events consistently, you may lose the operational advantage even if the optics “work.”
Should we buy OEM-only to avoid risk?
Not necessarily, but you should treat third-party optics as a controlled rollout. Run acceptance tests for link stability, DOM telemetry, and temperature behavior; negotiate warranty and return logistics that match your maintenance window constraints.
What is the fastest troubleshooting sequence when optics misbehave?
Start with cleaning and inspection, then measure optical power and check link error counters and FEC/forward error correction status when available. Only then verify switch software compatibility and DOM telemetry mapping, because physical layer issues are still the most common root cause.
Choosing between 400G and 800G is ultimately a telecom costs optimization problem across optics, ports, power, and maintenance operations. If you want to extend this decision to your cabling and test workflow, use fiber cabling loss testing as your next step.
Author bio: I have deployed and validated high-speed Ethernet optics in production telecom and data-center environments, focusing on DOM telemetry, link stability, and acceptance testing under real traffic. I help teams translate transceiver specs into measurable operational outcomes: lower MTTR, predictable power, and fewer integration surprises.