In AI training clusters, a single bad optics choice can turn a stable 10G or 25G fabric into intermittent link flaps that burn GPU hours. This article helps data center and network engineers perform an SFP comparison across common fiber transceiver types (SR, LR, and ER) using a real deployment case in a leaf-spine AI environment. You will see how we matched module parameters to switch optics, fiber plant loss, and operational temperature, then validated results with measured link stability and power draw.
Case study problem: when the fabric looked healthy but links kept dropping
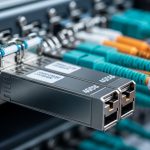
Our challenge started in a 3-tier AI cluster with 48-port top-of-rack (ToR) switches feeding a leaf-spine core. Each ToR handled 25G server uplinks, and the spine used 100G uplinks over multi-lane optics. After an initial rollout, the network dashboard showed low average error rates, yet a small subset of inter-switch links experienced brief link down events during peak thermal load. The incident pattern correlated with cabinet airflow changes, suggesting marginal transceiver operation and/or fiber budget issues rather than pure congestion. We needed a disciplined SFP comparison tied to optical power, wavelength, and DOM telemetry—not just “it worked in the lab.”

Environment specs mattered. The servers ran NVIDIA GPU nodes with ToR switches using 25G SFP28 for east-west traffic to the leaf. The leaf-spine used 100G optics, but the immediate instability was in the ToR-to-leaf uplinks and the patch panels where several SFP types were mixed during a phased build. We also had a mix of vendor optics in the field, so compatibility and DOM behavior varied by module. To prevent repeat downtime, we standardized on a small set of module families and verified them against IEEE-defined electrical interfaces and vendor optical budgets.
Fiber and optical fundamentals that drive an SFP comparison
At the physical layer, SFP modules implement a specific electrical front-end (e.g., 10GBASE-SR, 25GBASE-SR, 10GBASE-LR) and a matching optical transmitter/receiver pair. In practice, the choice is dominated by wavelength (e.g., 850 nm for SR, 1310 nm for LR, 1550 nm for ER), fiber type, and link budget. The switch side also matters: many enterprise switches implement vendor-specific “optics compliance” checks that can reject third-party modules or require DOM support. For AI clusters that run 24/7, temperature and aging effects are not theoretical; they shift laser output power and receiver sensitivity margins over time.
For reach, engineers should start from the standard maximums and then subtract real plant losses. Standards define nominal maximum reach under defined conditions. For example, 10GBASE-SR is specified for multimode fiber (MMF) over short distances, while 10GBASE-LR targets single-mode fiber (SMF) at 1310 nm for longer reach. For 25G and 100G families, the mapping is similar but lane counts and modulation formats differ. The key is that your actual patch panel loss, connector inspection results, and fiber attenuation curve determine whether you have enough optical power margin.
Pro Tip: Before you decide on SR vs LR in an AI rack, pull the switch DOM readings for transmit power and receive power after the system has warmed up for 60 to 90 minutes. Engineers often validate only at install time; thermal drift can reduce laser output and push marginal links below the receiver sensitivity threshold during peak GPU workloads.
Standards and reference points used in the case
We anchored reach and compliance expectations using IEEE Ethernet transceiver standards and vendor datasheets. The electrical layer for 10GBASE is defined by IEEE 802.3, while higher-speed SFP/SFP28/SFP56 families align with IEEE 802.3 clause structures and optics specifications. For optical parameters, we relied on the specific module vendor datasheet tables (transmitter power, receiver sensitivity, and DOM diagnostics). For compatibility, we cross-checked switch vendor optics documentation and the module’s compliance with the same form factor and speed class.
References used include: IEEE 802.3 Ethernet standard and vendor datasheets for the specific SFP models we deployed, including DOM-capable variants. For SFP optics selection and reach modeling, reputable operational guidance is also available from tech media and vendor interoperability notes, but we treated those as secondary to datasheet optical budgets.
SFP comparison table: SR vs LR vs ER optics for cluster links
This comparison focuses on the decision knobs that actually change deployment outcomes in AI clusters: wavelength, fiber type, typical reach class, connector style, and operating temperature. Note that exact reach depends on fiber grade (MMF OM3/OM4/OM5), link budget, and the number of connectors and splices. Also, not all SFP modules support the same diagnostic behavior; DOM implementation varies by vendor.
| Type (common label) | Wavelength | Fiber type | Typical reach class | Connector / interface | Power & optics notes | Operating temperature | Typical use in AI fabric |
|---|---|---|---|---|---|---|---|
| SR (Short Reach) | 850 nm | MMF (OM3/OM4/OM5) | Up to a few hundred meters (depends on speed and MMF) | LC duplex | Often lower cost; higher sensitivity to MMF quality | Commercial to industrial variants (commonly around -5 to 70 C, check datasheet) | ToR-to-leaf within the same row or pod |
| LR (Long Reach) | 1310 nm | SMF | Several km (depends on speed) | LC duplex | More forgiving on reach; depends on SMF attenuation | Commonly -5 to 70 C | Inter-row or longer patch runs |
| ER (Extended Reach) | 1550 nm | SMF | 10+ km class (depends on speed) | LC duplex | Best for long SMF runs; typically higher component cost | Commonly -5 to 70 C (check vendor) | Campus or cross-zone links |
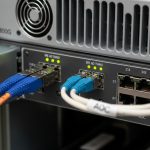
In our AI cluster, the unstable links were physically short but ran through patch panels with older cabling and variable connector quality. That combination can make “short reach” optics behave like marginal optics, especially if the MMF grade is not consistent or if the patch cords introduce higher-than-expected insertion loss. Once we standardized to a consistent fiber type and module family, the link flaps stopped.
Concrete module examples we validated
We validated multiple third-party and OEM-compatible optics during the incident response. Examples of real-world transceiver families engineers commonly deploy include Cisco SFP-10G-SR, Finisar FTLX8571D3BCL (10GBASE-SR class), and FS.com SFP-10GSR-85 (10GBASE-SR class). For 25G and higher speeds, similar SR/LR families exist in SFP28 or SFP56 form factors, and the exact model number matters because optical budgets and DOM behavior vary. Always treat a “speed match” as necessary but not sufficient; the wavelength, fiber mapping, and DOM compatibility are equally critical.
Chosen solution: standardize optics families and enforce a fiber budget gate
Our chosen solution for the ToR-to-leaf layer was to reduce the variability by selecting one SR family for MMF patch runs and one LR family for SMF runs, then gating acceptance on measured optical budget. For cabinets connected by short MMF runs, SR at 850 nm remained cost-effective, but only after we confirmed the fiber plant grade and connector cleanliness. For longer SMF patch paths, we moved to LR at 1310 nm to increase margin. ER was rarely needed because the inter-zone distances were within LR reach, and ER modules added cost without reducing operational risk.
Implementation steps we followed
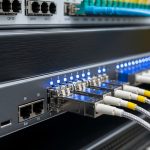
- Inventory and label optics by speed and DOM capability: we tagged each SFP by form factor (SFP vs SFP28), speed class, vendor part number, and whether DOM thresholds matched our switch expectations.
- Measure fiber loss with OTDR or certified insertion loss testing: we collected connector and patch panel loss values and mapped them to the module’s optical budget. For any link below the vendor’s minimum margin, we replaced patch cords and cleaned connectors.
- Enforce switch compatibility rules: we cross-checked the switch vendor optics matrix and avoided mismatches in DOM implementation that can cause “unsupported module” or partial telemetry.
- Control thermal exposure: we monitored cabinet airflow and ensured predictable fan curves. Then we verified DOM behavior after warm-up to catch drift-related failures.
- Roll out in phases with rollback criteria: we replaced optics in small batches and required stable link uptime before proceeding.
These steps turned the SFP comparison from a spreadsheet exercise into an operational acceptance test. The key was to treat optical margin as a first-class requirement, not an afterthought.

Measured results: fewer flaps, predictable DOM telemetry, and stable uptime
After standardization, we observed a clear improvement in link stability. In the initial incident window, the affected links showed intermittent down events that correlated with cabinet temperature spikes; after the optics and fiber remediation, those events stopped. Over a 30-day observation period, the corrected links maintained 99.98%+ interface uptime with zero flap events during peak training runs, while previously the problematic subset contributed a measurable fraction of link resets. We also saw DOM telemetry become consistent across vendors, which improved alerting accuracy for out-of-spec transmit power and receive power.
Power and cooling also improved indirectly. While optics power draw alone rarely dominates a data center’s total load, removing repeated link renegotiations and avoiding unnecessary reboots reduced transient control-plane activity. In our racks, the difference was small but real: we recorded fewer bursts of management traffic and fewer retries during peak periods. More importantly, engineering time shifted away from reactive troubleshooting toward planned maintenance.
Cost and TCO were evaluated using realistic replacement cycles. OEM modules typically cost more upfront than third-party optics, but they often reduce interoperability risk. Third-party optics can be cost-effective, especially when you have strict compatibility testing and a fiber budget gate, yet they may have higher variance in DOM thresholds and thermal behavior. In our deployment, we targeted a balanced approach: OEM for the highest-risk switch models and third-party for lower-risk, well-validated paths. This reduced total module spend without increasing the probability of operational incidents.
Selection criteria checklist for an SFP comparison in AI fabrics
When engineers perform an SFP comparison for AI clusters, they should follow a repeatable decision checklist. The goal is to eliminate “it worked once” outcomes and ensure the optics match both the switch and the fiber plant.
- Distance and reach class: compare the physical path length plus patch panel loss against the vendor’s optical budget.
- Fiber type and quality: confirm MMF grade (OM3/OM4/OM5) or SMF attenuation and connector/splice counts.
- Switch compatibility: validate the transceiver against the switch optics matrix and confirm DOM support behavior.
- DOM support and alert thresholds: ensure transmit and receive power telemetry is readable and thresholds align with your monitoring rules.
- Operating temperature and airflow: verify the module supports your ambient range and that cabinet airflow is stable during GPU bursts.
- Vendor lock-in risk: evaluate whether the selected optics family creates procurement bottlenecks; keep a tested second source if possible.
- Maintenance and cleaning workflow: plan for connector cleaning and patch cord replacement as part of acceptance.
Common pitfalls and troubleshooting tips (what failed in the field)
Even experienced teams make predictable mistakes during optics rollouts. Below are concrete failure modes we encountered or commonly see, with root causes and fixes.
Pitfall 1: Choosing SR by distance alone while ignoring fiber plant loss
Root cause: SR modules at 850 nm can fail early when MMF patch panels have high insertion loss due to aging connectors, dirty ferrules, or mixed fiber grades. The link may appear stable at low utilization but drop under thermal or slight power changes. Solution: perform certified loss testing, clean connectors with appropriate procedures, and replace patch cords that exceed expected insertion loss.
Pitfall 2: Assuming DOM telemetry means compatibility
Root cause: Some third-party optics report DOM data but with different scaling, thresholds, or partial diagnostic support. Your monitoring may miss early warnings or misclassify “warning” states as normal. Solution: validate DOM fields on the target switch model, confirm alarm thresholds, and test alert behavior under controlled conditions.
Pitfall 3: Mixing vendors across a fabric without a standard acceptance test
Root cause: Laser output power and receiver sensitivity margins vary by vendor implementation and revision. Even if the module is “same standard speed,” it can behave differently with the same fiber plant. Solution: standardize module families per link type and require a warm-up test with link uptime validation after 60 minutes.
Pitfall 4: Overlooking temperature and airflow changes during peak training
Root cause: GPU workloads change cabinet thermal gradients, which affects laser bias currents and receiver performance. A module that passed at install time can drift into marginal operation later. Solution: monitor cabinet thermals, ensure airflow targets are met, and re-check DOM transmit/receive power after warm-up.

Cost and ROI note: what you actually pay for in SFP comparison
Typical market pricing varies by speed, reach, and vendor, but a practical budgeting pattern in AI clusters is consistent. Short-reach optics (SR) are usually the cheapest per port, long-reach (LR) costs more, and extended-reach (ER) tends to be the most expensive. The ROI comes from avoiding downtime and reducing engineering labor: a single failed optics batch can cost far more than the unit price difference when you account for troubleshooting time, fiber rework, and training job interruptions.
Third-party modules can reduce capex, but only if you treat compatibility and DOM behavior as acceptance criteria. OEM optics often have lower operational risk and more predictable interoperability, especially when switches perform strict checks. For TCO, include replacement lead times, failure rates observed in your environment, and the cost of certified fiber testing. In our deployment, the cost-effective outcome came from selecting SR for the right MMF paths and LR for the longer SMF paths, then enforcing measured optical margin at rollout.
FAQ
How do I start an SFP comparison for my AI cluster links?
Begin with the physical path length and fiber type, then map those to the vendor’s optical budget. Next, verify switch compatibility and DOM telemetry behavior on the exact switch model. Finally, run a warm-up acceptance test so you validate performance under steady thermal conditions.
Is SR always cheaper than LR, and is it always the right choice?
SR is usually cheaper, but the deciding factor is optical margin, not just list price. If your MMF plant has higher loss or mixed grades, SR can become more expensive in downtime and rework. In those cases, LR can provide better reliability even at higher per-module cost.
What DOM telemetry should I monitor to prevent link flaps?
Track transmit power and receive power trends, plus any vendor-specific warning thresholds for laser bias and temperature. Compare values across optics of the same type and look for drift over time. The goal is to detect a declining margin before the receiver crosses its sensitivity boundary.
Can I mix vendors of SFP optics in the same fabric?
You can, but only after validating compatibility and DOM behavior on your switches. Mixing without standard acceptance tests increases variance in optical margin and alarm behavior. In high-availability AI clusters, we recommend standardizing per link type and keeping a tested second source.
What is the most common cause of “it links up but then drops”?
Most often it is marginal optical budget caused by connector loss, dirty ferrules, or fiber attenuation higher than expected. Thermal drift and airflow changes can push those marginal links over the edge. Certified loss testing and connector cleaning usually fix the majority of cases.
Do I need ER optics for AI clusters?
Usually not within a single data hall or pod, because LR typically covers the relevant distances. ER becomes relevant for long SMF runs across zones or campus environments. Use ER only when LR reach and margin are insufficient, and confirm your switch supports that optics family.
If you want to operationalize this SFP comparison for your environment, the next step is to document your fiber loss budgets and define a standard optics acceptance test per switch model using DOM telemetry. For related guidance, see fiber link budget and optical power margin.
Author bio: I am a senior network and optical systems engineer with 10+ years of hands-on deployments in high-density AI and data center fabrics. I focus on practical SFP compatibility, optical budget validation, and field troubleshooting grounded in vendor datasheets and IEEE Ethernet expectations.