When an eye diagram optical transceiver link starts dropping frames or showing CRC errors, the root cause is often signal integrity rather than “link speed.” This article helps data center and network engineers test, interpret, and act on eye diagram results so you can qualify optics for production. You will learn what to measure, how to set up repeatable test conditions, and how to troubleshoot the three most common failure points in the lab and during rollout.
Prerequisites and test setup for eye diagram optical transceiver validation
Before you probe the waveform, align the test plan with how your switch and optics actually behave in service. In my deployments, the biggest time loss comes from measuring the wrong reference point (host side vs optical side) or using incompatible settings that mask jitter and noise.
Prerequisites
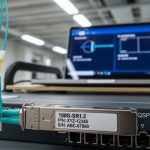
- Optics under test: e.g., Cisco SFP-10G-SR, Finisar FTLX8571D3BCL, or FS.com SFP-10GSR-85 (confirm the vendor and temperature rating).
- Test equipment: a real-time or sampling oscilloscope with optical/electrical bandwidth appropriate for the data rate, plus an optical-to-electrical receiver head or module that matches your transceiver class.
- Test pattern: PRBS31 or PRBS7 depending on your scope and link rate; ensure the pattern matches the optics’ transmitter/receiver behavior.
- Reference channel: either a known-good transceiver or a calibrated optical test path to separate optics issues from fiber/connectors.
Step-by-step implementation
-
Define the measurement point in the signal chain.
Expected outcome: You will capture the eye at a consistent location (electrical after O/E conversion or directly at the module electrical pads, depending on your lab tooling).
-
Confirm compliance targets for the module class and data rate.
Expected outcome: Your pass/fail criteria become evidence-based rather than subjective (e.g., IEEE 802.3 link characteristics and vendor datasheet guidance). [Source: IEEE 802.3 Ethernet standards]
-
Set scope bandwidth and acquisition mode to avoid “fake eyes.” Use the oscilloscope bandwidth at or above your Nyquist requirement for the baud rate.
Expected outcome: The eye opening and crossing jitter reflect the actual signal, not instrument roll-off.
-
Stabilize the optical link before capturing.
Expected outcome: With steady bias and temperature, the eye diagram stops wandering and becomes repeatable across runs.

How to interpret an eye diagram optical transceiver: what to measure
An eye diagram is a composite view of symbol transitions over many bit periods, revealing timing jitter, amplitude distortion, noise, and inter-symbol interference. For an eye diagram optical transceiver, you primarily want to quantify whether the receiver decision threshold has enough margin for worst-case conditions like temperature drift and aging.
Key measurements
- Eye height: relates to amplitude margin; reduced height often indicates insufficient optical power, excessive attenuation, or receiver saturation.
- Eye width: relates to timing margin; narrow eyes suggest clock recovery stress and high jitter.
- Crossing points: measure jitter at a specific voltage crossing; compare to your system’s jitter tolerance assumptions.
- Rise/fall degradation: can indicate bandwidth mismatch in the test path or transmitter drive issues.
- Random vs deterministic jitter: if you can separate them, deterministic components frequently track with pattern-dependent distortion and channel reflections.
Practical pass/fail approach
In production qualification, I recommend setting a baseline using a known-good optic at the same data rate and fiber type, then requiring measurable margin improvement. For example, in a 10G SR rollout, if the eye height of the candidate optics is within a small percentage of the baseline at room temperature but collapses after a thermal chamber step, you likely have a transmitter bias or aging sensitivity issue.
Pro Tip: If your eye looks “open” but the link still fails CRC, capture at two points: one after the O/E conversion and one closer to the module electrical interface. A clean electrical eye with bad link outcomes usually points to receiver decision margin problems, while a noisy electrical eye suggests optical power or bandwidth mismatch. This split approach prevents weeks of chasing the wrong layer.
Bench-to-rack comparison: test optics at the same wavelengths and tolerances
Data centers rarely have identical fiber plants, connector cleanliness, or thermal conditions between lab and rack. Before you conclude the optics are the problem, verify that your test wavelength, reach class, and connector geometry match the deployment reality.
Spec alignment you should verify
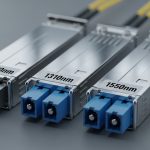
- Wavelength (e.g., 850 nm for SR multimode, 1310/1550 nm for other classes).
- Reach and fiber type (OM3/OM4 multimode vs OS2 single-mode).
- Optical power and receiver sensitivity if your vendor provides them.
- Operating temperature range and whether the module supports the cooling profile of your rack.
- DOM support and whether your switch tolerates the vendor’s digital diagnostics implementation.

Technical specifications table (example optics classes)
| Parameter | 10G SR (850 nm MMF) | 10G LR (1310 nm SMF) | 40G/100G (example long-reach class) |
|---|---|---|---|
| Typical wavelength | 850 nm | 1310 nm | Varies (often 1310/1550 nm) |
| Typical reach class | Up to 300 m on OM3/OM4 (depends on standard) | Up to 10 km on SMF | Can be 10 km+ depending on optics |
| Data rate | 10.3125 Gb/s (10G Ethernet) | 10.3125 Gb/s | 40G or 100G (varies by module) |
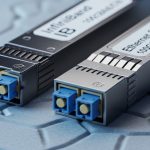
| Connector | LC (common for SR/LR optics) | LC (common) | LC or MPO/MTP (depends on module) |
| Operating temperature | Often 0 to 70 C or extended options | Often 0 to 70 C or extended options | Varies; verify extended spec |
| DOM / DDM | Common but not universal | Common but not universal | Common for higher-speed optics |
Because exact power and sensitivity vary by vendor part number, treat the table as a planning reference. Pull the exact optical budget and temperature spec from the transceiver datasheet for your selected part. [Source: Vendor datasheets for specific transceivers]
Implementation guide: step-by-step eye diagram optical transceiver testing
Use this workflow to turn eye diagram analysis into a repeatable qualification gate. I have used it to approve batches of optics before rolling them into leaf-spine racks, where one bad batch can create intermittent congestion and hard-to-trace packet loss.
Step-by-step procedure
-
Recreate the channel as closely as possible.
Expected outcome: Use the same fiber type, patch cord length, and connector style as the target rack. If you must use a different length, document the delta and compensate with optical attenuation.
-
Run PRBS31 (or PRBS7 if required) for a fixed dwell time.
Expected outcome: The eye diagram becomes statistically stable; you can compare multiple captures without “pattern luck.”
-
Capture eye at nominal temperature (e.g., 23 C or your lab standard).
Expected outcome: You establish a baseline eye height and width under steady bias.
-
Stress with temperature or link margin.
Expected outcome: In a thermal chamber, step to your upper expected environment (commonly 60 to 70 C for many standard optics). If the eye collapses early, reject the batch or investigate bias instability.
-
Compare against baseline optics.
Expected outcome: You apply acceptance thresholds you defined earlier (e.g., minimum eye opening ratio and maximum jitter crossing variation across runs).
-
Validate with a live link test before deployment.
Expected outcome: You confirm with counters (CRC/FCS, interface errors, and if available, optical power readings via DOM/DDM).

Real-world deployment scenario: qualifying optics in a leaf-spine rollout
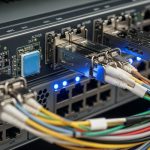
In a 3-tier data center leaf-spine topology with 48-port 10G Top-of-Rack switches, we replaced a set of SR optics across 20 racks during a maintenance window. The lab qualification used 850 nm SR transceivers over OM4 patch cords, but the rack rollout included mixed patch cord lengths: 3 m, 7 m, and 12 m. After one batch showed intermittent CRC errors, eye diagram captures revealed reduced eye height and increased jitter crossing variation near the upper thermal step, even though nominal captures at room temperature looked acceptable. The fix was not “more power,” but rejecting the batch and re-cleaning LC connectors on the longest cords, since micro-scratches amplified deterministic distortion.
Selection criteria checklist for an eye diagram optical transceiver test program
-
Distance and fiber class: match SR/LR wavelength and reach class to the plant.
-
Data rate and modulation type: ensure your test gear bandwidth and sampling strategy match the baud rate.
-
Switch compatibility: confirm transceiver support lists and whether the switch requires specific DOM/DDM behavior.
-
DOM support and calibration: verify