In leaf-spine data centers, transceiver choice can quietly determine whether a dense rack stays within power, cooling, and cable-management limits. This article helps network engineers and QA/reliability reviewers make a density comparison between SFP and QSFP optics using real-world deployment constraints: port density, reach, temperature ratings, and operational reliability. You will also get a step-by-step implementation plan, troubleshooting for common failure modes, and a checklist aligned with field verification practices and vendor datasheet realities.
Prerequisites for a reliable density comparison (SFP vs QSFP)
")
Before you compare packaging density, collect the same inputs across both transceiver families. Start with the exact switch models and line cards, because QSFP/SFP lane mapping and DOM handling differ by vendor and sometimes by firmware release. Then validate optics and fiber plant constraints: planned reach, fiber type (OM3/OM4/OS2), patch panel loss, and budget for aging and cleaning variability. Finally, define acceptance criteria tied to reliability: error counters, link flaps tolerance, and environmental limits (temperature, airflow, and dust).
What you should have on hand
- Switch and transceiver compatibility list from the vendor support matrix (or verified third-party list).
- Port layout details: whether the chassis supports breakout (for QSFP variants) and how many lanes are consumed.
- Fiber plant metrics: measured insertion loss and worst-case end-to-end loss, not just cable specs.
- Environmental data: intake temperature, expected airflow direction, and whether the rack uses front-to-back cooling.
- DOM monitoring plan: which telemetry fields you will poll (Tx/Rx power, temperature, bias current).
Expected outcome: you can compare density using the same assumptions for reach, power, and operational limits rather than marketing claims.
How physical packaging changes port density and airflow
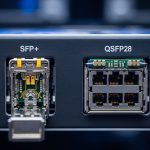
SFP and QSFP differ mainly in form factor and electrical lane grouping, which directly affects how many links you can fit per rack unit and how much thermal headroom you retain. In practice, QSFP is often used for higher per-port bandwidth (for example 40G/100G families), while SFP is common for 1G/10G/25G. The key reliability point is that higher density can increase local heat flux around cages and can stress optics temperature margins during sustained peak traffic.
Density comparison in real racks: the “per RU and per lane” lens
When teams do density comparison, they often count ports, but field issues come from lane consumption and cooling. For example, a QSFP28 100G port may consume four lanes, while a breakout mode (like 4x25G) multiplies endpoints and can increase total optics count. Conversely, an SFP-based design might use more ports at lower per-link bandwidth, but it can reduce per-cage heat concentration depending on the switch’s thermal design. Your best comparison method is to compute: links per rack unit, total transceiver count, and aggregate optical power dissipation under load.
Pro Tip: In high-density deployments, the dominant reliability limiter is often not average temperature but the optics cage hotspot created by adjacent transceivers plus restricted airflow. During acceptance testing, log DOM temperature every 1 to 5 minutes for at least 2 hours at the expected traffic profile, then compare the maximum observed temperature against the vendor’s rated operating range. This catches “works in the lab, fails in the rack” cases caused by thermal gradients.
Specs that actually matter: reach, power, connectors, and temperature
For density comparison, you need specs that drive both performance and reliability: wavelength, reach, connector type, transmit power, receiver sensitivity, and operating temperature. Vendors publish these in datasheets, but the values you care about depend on the transceiver family and speed grade. In Ethernet optics, the relevant physical layer requirements map to IEEE 802.3 specifications and the vendor’s implementation details. Use the vendor’s maximum supported link length and the datasheet’s DOM compliance notes to avoid silent incompatibilities.
Representative transceiver spec comparison (typical examples)
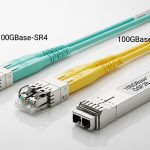
Below is a practical comparison using common 10G SFP+ and 100G QSFP28 multimode examples engineers often evaluate for leaf-spine and ToR aggregation. Exact numbers vary by vendor part number, but the table shows the decision-critical dimensions: wavelength band, reach, connector, power class, and operating temperature.
| Parameter | SFP+ (10G SR class) | QSFP28 (100G SR4 class) |
|---|---|---|
| Typical data rate | 10.3125 Gbps | 103.125 Gbps (4 lanes) |
| Wavelength | 850 nm (MMF) | 850 nm (MMF) |
| Typical reach on OM4 | Up to about 400 m (class-dependent) | Up to about 150 m to 300 m (class-dependent) |
| Connector | LC (duplex) | LC (typically MPO-12 or MPO-16 interface depending on module) |
| Optical interface type | Dual-fiber simplex pairs (TX/RX) | MPO trunk with four lanes internally mapped |
| DOM / monitoring | Commonly supported (I2C, temperature, power) | Commonly supported (I2C, lane power and temperature) |
| Operating temperature range | Often around -5 C to 70 C (verify per part) | Often around 0 C to 70 C (verify per part) |
| Typical power dissipation | Low-to-moderate (verify per datasheet; often ~1 W to 2 W class) | Moderate-to-higher (verify per datasheet; often ~3 W to 5 W class) |
Expected outcome: you can translate density into thermal stress and link budget risk, rather than just counting cages.
For standards context, IEEE 802.3 defines the Ethernet physical layer behavior, while optics vendors specify implementation details such as receiver sensitivity and transmitter launch power. Reference points include IEEE 802.3 for 10G and 100G Ethernet physical layer requirements and vendor datasheets for exact optical parameters. IEEE 802.3 standard and vendor documentation for specific modules such as Cisco SFP-10G-SR, Finisar FTLX8571D3BCL, and FS.com SFP-10GSR-85 for SFP+ SR variants (exact fit depends on switch compatibility).
Implementation steps: run a controlled “density comparison” test
This section is written as an implementation guide you can execute during staging or pre-rack acceptance. The goal is to measure link stability and thermal behavior under real traffic patterns, then decide whether SFP or QSFP provides better density comparison for your specific environment. Do not skip compatibility checks; optics that pass basic link bring-up can still fail later due to DOM polling quirks or marginal receiver sensitivity in your fiber plant.
Select candidate transceivers and confirm switch support
Choose a small set of verified part numbers for both families. Examples of widely used families include 10G SR SFP+ and 100G SR4 QSFP28, but you must confirm that your switch model supports the exact transceiver type and speed mode. Use the vendor compatibility matrix and firmware notes, because some platforms enforce strict DOM vendor ID checks.
Expected outcome: a short list of approved SFP+ and QSFP28 modules with known DOM behavior for your exact switch line card.
Model the density comparison using lane and breakout rules
Compute the number of transceivers needed to deliver your target throughput. If you use QSFP breakout (for example 1x100G to 4x25G), you may increase optics count and cable complexity even if port count decreases. Include connector type constraints: MPO trunks require careful polarity and cleaning practices; LC duplex cabling is more forgiving but uses more physical space per connection.
Expected outcome: a quantified plan: links per rack unit, transceiver count, and total expected power dissipation per row.
Validate fiber link budget and cleanliness controls
Use measured loss values from your patch panels, adapters, and splices. For multimode SR optics at 850 nm, modal distribution and connector cleanliness can dominate margin. In QA terms, treat fiber cleaning as a process control: document wipe method, end-face inspection results, and dust cap usage during installation.
Expected outcome: a pass/fail for link budget under worst-case attenuation and a documented cleaning SOP.
Deploy in a staging rack and run a reliability-focused test window
Bring up the links at the intended speed and configure traffic so it stresses optics thermals and link error handling. For Ethernet, run continuous line-rate traffic for at least 2 hours, then extend to 24 hours if you can. Capture telemetry: interface counters (including CRC/FCS and symbol errors), DOM temperature, and optical power levels if supported.
Expected outcome: evidence that both SFP and QSFP options meet your acceptance thresholds, not just that they link.
Compare thermal margins and operational stability
Evaluate the maximum observed DOM temperature and any trend upward over the test window. If QSFP cages show higher peak temperatures, compare against the vendor’s rated operating range and the switch’s thermal throttling behavior. Also check whether the switch’s fan profile or airflow management changes during sustained load.
Expected outcome: an evidence-based density comparison: which option delivers stable links with acceptable thermal headroom.
Selection criteria checklist for engineers (ordered)
Use this ordered checklist to choose between SFP and QSFP in a way that aligns with reliability engineering and operational constraints. The ordering reflects what typically causes outages or costly rework: compatibility and thermal risk first, then reach and monitoring, then cost.
- Distance and fiber type: OM3 vs OM4 vs OS2; confirm measured end-to-end loss and connector loss.
- Switch compatibility and firmware behavior: confirm approved optics lists and DOM support for your platform.
- Density goal: links per rack unit, not just port count; include breakout lane consumption.
- Temperature range and airflow: check operating range and verify with DOM hotspot logging in your rack airflow conditions.
- DOM and monitoring strategy: ensure you can read temperature and optical power reliably for troubleshooting.
- Power budget and thermal impact: estimate cage power dissipation under load and validate rack cooling capacity.
- Vendor lock-in risk: evaluate whether third-party modules are accepted without intermittent DOM or provisioning failures.
- Serviceability: consider module replacement time, availability lead times, and whether MPO polarity handling is part of your maintenance skill set.
Expected outcome: a defensible decision record tied to measured risk, not assumptions.
Common mistakes and troubleshooting tips (top failure modes)
Below are concrete pitfalls seen in field deployments. Each includes likely root cause and a practical solution path. Treat these as a QA checklist during commissioning and as a first-response guide when links degrade.
Failure point 1: “Links come up but errors climb under load”
Root cause: marginal optical power budget, contaminated connectors, or insufficient link margin due to unmeasured patch panel loss growth. In QSFP MPO systems, polarity or lane mapping mistakes can also create asymmetric performance.
Solution: measure TX/RX optical power via DOM, clean and re-terminate/inspect fiber ends, verify MPO polarity end-to-end, and re-run traffic tests while monitoring CRC/FCS and symbol errors.
Failure point 2: “Intermittent link flaps or module not recognized”
Root cause: DOM compatibility mismatch, firmware strictness, or poor cage seating. Some switches enforce vendor ID or require specific DOM implementation details; third-party modules can intermittently fail when the platform polls I2C and receives unexpected values.
Solution: confirm the exact part number against the compatibility matrix, reseat modules with correct orientation, update switch firmware to the vendor-recommended version, and capture event logs around each flap.
Failure point 3: “Thermal throttling or early degradation after rack install”
Root cause: airflow restriction, blocked vents, or too-tight cable routing trapping heat near cages. QSFP modules often dissipate more per module and can create hotspot conditions when packed densely.
Solution: verify rack airflow direction and obstructions, adjust cable management to avoid blocking intake vents, run a 2 to 4 hour sustained load test, and compare peak DOM temperature to the datasheet operating range.
Cost and ROI note: where the real TCO differences show up
Pricing varies by speed grade and vendor, but in many procurement cycles SFP optics are often cheaper per module than QSFP optics, while QSFP can reduce the number of high-speed ports needed to achieve a throughput target. The ROI question is not only purchase price; it is total transceiver count, spares strategy, power and cooling impact, and failure cost. OEM modules sometimes carry higher unit cost but can reduce compatibility risk and shorten troubleshooting time.
In typical enterprise and colocation environments, engineers see third-party QSFP modules priced lower, but they may require stricter compatibility validation and can increase commissioning effort. For TCO, include: module unit cost, expected lifespan, failure rate handling (RMA logistics), and the operational cost of labor spent on cleaning and polarity management. If QSFP MPO cabling increases maintenance complexity in your org, that labor cost can outweigh the initial savings.
FAQ
How do I run a practical density comparison for SFP vs QSFP in my rack?
Compute links per rack unit and transceiver count for your target throughput, then add thermal and monitoring constraints. Run a staging test that logs DOM temperature and interface error counters for at least 2 hours under sustained traffic. This turns the density comparison into measured operational risk.
Is QSFP always higher density than SFP?
Not necessarily. QSFP can reduce port count, but breakout modes (like 4-lane to multiple lower-speed links) can increase total optics and cable endpoints. If your design does not use breakout, QSFP usually wins on port density; if it does, the total optics count may narrow the gap.
What fiber and connector issues are most common with QSFP SR4?
MPO polarity and lane mapping mistakes are common, especially during patch panel changes. Connector cleanliness and end-face inspection frequency also matter more because MPO trunks involve more interfaces per link path.
Do I need DOM support for reliability acceptance testing?
Yes, DOM telemetry is valuable for correlating errors with temperature and optical power. Even if the link passes initially, DOM can reveal drift or marginal power levels before failures become visible in counters.
Are third-party optics safe for high-density data centers?
They can be, but you must validate exact part numbers against your switch compatibility matrix and test in your actual rack airflow. Treat third-party optics as a controlled change: run staging tests, monitor DOM readings, and document acceptance thresholds.
What is the fastest troubleshooting path for a link that flaps?
First, check switch logs for module recognition events and interface resets. Then verify optics seating, confirm DOM health, and validate fiber cleanliness and polarity. If the problem persists, test with a known-good approved module and narrow down whether the issue is optic-specific or plant-specific.
If you want to improve reliability beyond density comparison alone, evaluate your airflow design and fiber cleanliness controls as part of the same acceptance process. Next step: review how to build an optics acceptance test plan to standardize commissioning and reduce repeat incidents.
Author bio: I am a field reliability and QA engineer who has validated high-density Ethernet optics across multi-vendor switches using DOM telemetry, error-counter baselining, and environmental stress testing. I focus on actionable acceptance criteria that prevent “works on the bench” failures in production racks.