In a cost analysis data center project, the hardest part is separating “headline bandwidth gains” from measurable OPEX and deployment risk. This guide helps network and facilities teams estimate ROI when upgrading from 100G or 200G optics to 400G transceivers in real leaf-spine and spine-core fabrics. It also covers compatibility checks, DOM handling, power and cooling impacts, and the failure modes that routinely derail upgrade windows.
When 400G optics actually reduce total spend in a data center

ROI is rarely driven by transceiver price alone. In most upgrades, the financial win comes from reducing optics count per rack, shortening link fan-out, and enabling higher oversubscription efficiency without expanding switch port density. For example, moving from 4x100G to 1x400G can cut the number of pluggable modules and fiber terminations by roughly 75% for the same aggregate throughput, which lowers labor during install and reduces spares inventory complexity.
However, the cost analysis data center view must include switch port economics and power. Many 400G ports draw more per port than 100G, yet the per-bit energy can still improve if you consolidate traffic onto fewer physical links. In practice, teams budget for transceiver purchase cost, installation labor, transceiver validation time, optical budget verification, and potential re-cabling.
Operationally, the upgrade is also about availability risk. A 400G migration often touches multiple layers: ToR uplinks, spine downlinks, and sometimes firewall or load balancer aggregation points. If you underestimate DOM verification, optics provisioning, or mismatch between vendor firmware and transceiver EEPROM expectations, you can lose more time than the money you saved on optics.
400G transceivers: specs that drive reach, power, and compatibility
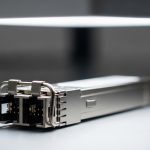
Before any ROI math, confirm the physical layer requirements: wavelength band, reach, connector type, and whether the transceivers support your switch’s transceiver management expectations (DOM, vendor ID handling, and control-plane policies). For data centers, the most common options are 400GBASE-SR8 (multimode) and 400GBASE-DR4 (single-mode), plus newer variants depending on platform.
Practical comparison table (common 400G optics)
| Module type | Data rate | Typical wavelength / lanes | Reach (typical) | Connector | Power (typical class) | Operating temperature | Best-fit use |
|---|---|---|---|---|---|---|---|
| 400GBASE-SR8 (e.g., QSFP-DD) | 400G | 850 nm, 8 lanes | ~70 m over OM4 (platform dependent) | LC duplex or MPO/MTP (varies by module) | ~10–15 W class | 0 to 70 C (commercial) | In-rack to short ToR-spine links |
| 400GBASE-DR4 (e.g., QSFP-DD) | 400G | ~1310 nm, 4 lanes | ~500 m over SMF (platform dependent) | LC duplex | ~8–12 W class | 0 to 70 C (commercial) | Spine-core or longer single-mode runs |
| 400G “LR4-like” variants (if supported) | 400G | ~1310/1550 nm bands, 4 lanes (varies) | ~2 km+ (depends on spec) | LC duplex | ~9–14 W class | 0 to 70 C or wider (varies) | Campus or metro extensions |
Note: Exact reach and power vary by vendor and switch implementation. Always validate against the switch transceiver compatibility list and the module datasheet. References: IEEE 802.3 for 400G Ethernet PHY families and vendor datasheets for reach/power assumptions. [[EXT:https://standards.ieee.org/standard/802_3][Source: IEEE 802.3]] [[EXT:https://www.cisco.com/c/en/us/products/interfaces-modules/qsfp-400g-transceivers/index.html][Source: Cisco optical transceiver documentation]]
Pro Tip: In the field, the biggest “gotcha” in a 400G cost analysis data center rollout is not optics reach—it is DOM policy. Some switch platforms enforce allowlists or expect specific EEPROM layouts; a module can be electrically compatible yet still be administratively rejected or run at reduced diagnostics mode, creating false alarms during link bring-up.
Cost analysis data center ROI model for 400G upgrades
Use a simple ROI worksheet that engineers can defend in change control. Start with the link consolidation factor, then layer in labor, power, and failure/return handling. For a typical consolidation scenario, you may reduce cabling and optics count by switching from 4x100G to 1x400G on the same uplink capacity.
Baseline assumptions (example you can adapt)
- Ports migrated: 96 uplinks per cluster (ToR to spine), each equivalent to 400G aggregate.
- Previous state: 4x100G optics per 400G equivalent path (384 modules total).
- New state: 1x400G optics per path (96 modules total).
- Module pricing (street range): OEM and reputable third-party often differ materially; plan for a wide band and verify with your purchasing team.
- Installation labor: count fiber terminations and transceiver touch time, not just module swap time.
ROI equation engineers use
Annual ROI = (Optics + spares savings + labor avoidance + power/cooling savings + reduced downtime cost) − (Incremental optics cost + re-cabling risk + validation time).
When power is included, use switch and optics power telemetry if available. If not, estimate optics power per module from datasheets and apply your PUE and cooling effectiveness. Cooling penalties can erase small optics efficiency gains if you route airflow differently or exceed rack thermal budgets.
Real-world deployment scenario
In a 3-tier data center leaf-spine topology with 48-port 10G/25G ToR access and 400G uplinks to a spine pair, an operator targeted 2,048 total 400G-equivalent links across two halls. They consolidated each uplink group from 4x100G to 1x400G on the same fiber plant, reducing optics handling from roughly 8,192 100G modules to 2,048 400G modules. The project team tracked change-window success by measuring link-up time, interface flaps, and DOM read integrity, and they planned spares to match the reduced module count. The final cost analysis data center report showed ROI depended more on installation labor and spares inventory reduction than on optics unit price alone.
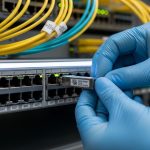
[[IMAGE:A photorealistic shot inside a modern data center aisle, a field engineer in high-visibility vest and hard hat holding a QSFP-DD 400G transceiver over an open switch chassis, fiber MPO/MTP cassettes visible on the rack, cool white overhead lighting, shallow depth of field, realistic cables and labels, documentary photography style, high resolution]
Selection criteria checklist: how to avoid ROI-killing surprises
Even when the cost analysis data center math looks good, you need a disciplined selection process. Use this ordered checklist during procurement and pre-staging.
- Distance and reach: confirm fiber type (OM3/OM4/OS2), measured link loss, and connector cleanliness. Don’t rely on “typical reach.”
- Switch compatibility: verify the exact module form factor (QSFP-DD), vendor compatibility list, and firmware expectations for 400G breakout behavior (if any).
- DOM and management support: validate that DOM readings (temperature, bias current, received optical power) are exposed and stable under your monitoring stack.
- Power and thermal limits: compare module power classes and ensure the rack can handle worst-case thermal density.
- Operating temperature range: match the module class to your environment; some deployments run at elevated inlet temperatures.
- Vendor lock-in risk: quantify the cost and lead time impact of OEM-only modules versus third-party options with validated compatibility.
- Warranty and RMA workflow: confirm advance replacement terms, expected turnaround, and whether RMA requires port logs.
DOM and optical budget verification steps (field-ready)
- Run an optical budget check using measured fiber attenuation and connector loss estimates before ordering.
- After install, verify DOM values within expected ranges and confirm alarms are not threshold-noisy.
- Log link-up time and any interface flaps during the first 24 to 72 hours.
[[IMAGE:An engineering infographic illustration showing a cost analysis data center ROI flowchart from “100G optics” to “400G optics,” with icons for optics quantity reduction, labor hours, power savings, and DOM validation checkmarks, clean vector style, teal and gray palette, flat design, high clarity text blocks]
Common pitfalls and troubleshooting tips during 400G migrations
Most failures are preventable if you treat optics like a controlled engineering change, not a simple swap. Here are concrete issues teams commonly hit, with root cause and corrective action.
Link fails to come up or stays down
Root cause: connector polarity or cleaning issues (especially MPO/MTP), damaged ferrules, or a mismatch between fiber lanes and the module expectations. Multimode polarity errors can appear as “random” failures across ports.
Solution: re-terminate or re-clean, confirm MPO/MTP polarity with a polarity tester, and verify which lanes map to which fibers on your structured cabling standard. Re-check the optical budget after any rework. Reference cleaning best practices from connector vendors and switch vendor optics documentation. [[EXT:https://www.fiber-optic.org/][Source: Society for Optical and Fiber Communications resources]]
Intermittent flaps under load
Root cause: marginal optical power due to aging, excessive insertion loss, or dust contamination that only manifests at higher transmit levels. In some cases, the module is electrically compatible but running near sensitivity limits.
Solution: compare received optical power from DOM across links; replace the worst offenders first. If the spread is wide, inspect patch cords and fanout assemblies. Re-run link characterization after cleaning.
Switch rejects optics or shows “DOM error”
Root cause: incompatible EEPROM layout or firmware policy differences. Some platforms enforce transceiver allowlists; others require specific DOM fields or threshold calibration.
Solution: confirm the module part number against the switch interoperability matrix. If you use third-party transceivers, stage them in a lab with identical switch firmware and run DOM read validation before scaling deployment.
Cooling budget overrun after consolidation
Root cause: increased total optical and switching power density per rack, plus changed airflow patterns when you re-cable or relocate patch panels.
Solution: verify inlet temperatures and rack thermal margins before cutover; use the vendor power estimates and validate with telemetry during a limited pilot.
Cost & ROI reality check: OEM vs third-party, TCO, and spares
In many markets, OEM 400G optics can cost several times more than basic third-party equivalents, but the “cheapest” option can increase operational cost if it drives RMA frequency or adds troubleshooting time. A realistic cost analysis data center should include spares strategy and failure handling cost, not just unit price.
- Price bands: expect wide variance by reach type (SR8 vs DR4), brand, and certification. Treat any single number as provisional until you get quotes.
- TCO drivers: installation labor, downtime risk, RMA turnaround, and monitoring integration time for DOM thresholds.
- Spare count: fewer 400G modules often means fewer spares overall, but ensure your spares match the exact part numbers and switch compatibility expectations.
If you can consolidate optics and avoid re-cabling, ROI can be fast. If re-cabling is unavoidable or if you must qualify multiple optics vendors during the cutover, ROI can slip due to extended validation and change-control overhead.
[[IMAGE:Concept art of a budget spreadsheet overlaying a data center rack layout, with glowing lines representing optical links and red warning triangles labeled “DOM error” and “thermal limit,” cinematic lighting, dark background, neon accents, stylized but technical, 3D isometric view]
FAQ
How do I start a cost analysis data center for 400G optics?
Begin with link consolidation: how many 100G or 200G modules you replace per equivalent 400G capacity. Then add labor for transceiver swaps and any fiber rework, plus power and cooling assumptions using vendor module power and switch telemetry. Finally, include validation time and spares/RMA costs.
Is 400G always cheaper per bit than 100G?
Not automatically. Unit price per module, switch port licensing, and power per port all matter. The most consistent savings come from reducing optics count, patching labor, and spares complexity when your fiber plant already supports the required reach and polarity.
Can I use third-party 400G transceivers without breaking monitoring?
Often yes, but you must validate DOM behavior on your exact switch model and firmware. In the field, monitoring systems can misinterpret thresholds if DOM calibration differs or if the platform restricts certain EEPROM fields. Stage in a lab and confirm alarm stability before production cutover.
What fiber testing should I do before ordering SR8 or DR4 modules?
Use measured link loss and connector insertion loss, and confirm polarity and lane mapping for MPO/MTP. If you are near the reach limit, clean and re-test before installation because dust and aging can push you over sensitivity thresholds.
What is the most common reason 400G links flap after upgrade?
The most common drivers are marginal optical power from dirty connectors or excessive insertion loss, and thermal or airflow changes that affect stability. Use DOM received power trending and rack temperature telemetry to isolate whether it is optical or environmental.
How long should I plan for validation during a 400G migration?
For a controlled pilot, plan for at least a few days of stability testing, including interface flap monitoring and DOM alarm verification. If you are introducing a new transceiver vendor or reach type, extend validation to cover longer traffic patterns and any seasonal thermal swings.
Author bio: A veteran network and field-operations reporter focused on