When a 400G optical link goes marginal, the first symptoms look random: CRC spikes, link flaps, or sudden receiver loss. This article helps network engineers, field technicians, and reliability teams perform practical troubleshooting across optics, fiber plant, and switch configuration. You will also get a selection checklist, common failure modes with fixes, and a ranking table to speed triage in the field.
Top 1: Verify the optics chain with deterministic link tests
Start with the optics chain, because most 400G outages trace back to module selection, optical budget mismatch, or incompatible vendor behavior. For 400G coherent transport you typically validate with the switch vendor optics compatibility list, then confirm lane mapping and expected optics type (for example, 400GBASE-FR4 or 400GBASE-DR4 in appropriate form factors). In 400G direct-detect (common in data centers), you also check whether the ports expect QSFP-DD or OSFP optics and whether the optics support the exact data rate and FEC mode.
Field steps that reduce guesswork
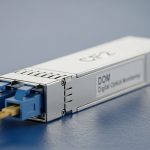
- Confirm the transceiver part number matches the datasheet requirements for wavelength and reach (for example, 400GBASE-DR4 uses four lanes and a specific wavelength grid). Record vendor and serial from the module label.
- Read DOM values (temperature, bias current, received power) immediately after link-up and during traffic load. Compare against vendor thresholds from the datasheet.
- Run a controlled test with a known-good far-end device or loopback module to isolate whether the issue is local or remote.
Best-fit scenario: Use this item when the link negotiates but performance is unstable, or when you see CRC errors that worsen after hours of operation. It is also the first step after a hardware swap, because DOM changes can confirm whether the replacement optics are truly the intended model.
Pros: Fast isolation of optics incompatibility; leverages vendor-defined DOM limits. Cons: Requires access to DOM and vendor thresholds; some switches hide detailed lane counters unless you enable diagnostics.

Top 2: Confirm fiber plant cleanliness and connector geometry
Even in well-run data centers, connector contamination remains a top cause of receiver power collapse. In 400G, the sensitivity can be higher than many 100G scenarios, so a small amount of dust or micro-scratches can push the link below receiver minimum. Your goal in troubleshooting is to prove whether the optical path is clean and mechanically sound before chasing settings.
What to check
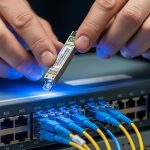
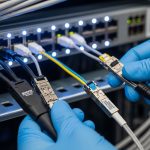
- Inspect both ends with a fiber microscope before and after cleaning. Look for film, scratches, and chips at the core area.
- Verify connector mating style and polarity handling. For multi-fiber breakout cables, confirm lane order and that the patch cords are truly paired as specified by the vendor.
- Ensure strain relief and bend radius are respected from the rack to the patch panel. Tight bends can increase loss and cause intermittent errors under thermal cycling.
Best-fit scenario: Use this item when you see intermittent LOS or RX power trending downward, especially after moves, additions, and changes (MACs). It also helps when the link fails only on specific channels or specific patch panel locations.
Pros: Often resolves the issue without changing hardware; improves long-term reliability. Cons: Requires microscopes and a consistent cleaning workflow; inspection time can slow initial triage.
Top 3: Match wavelength, reach, and FEC expectations to your port profile
400G links fail when the optics are technically “compatible” but not functionally aligned to the port’s expected mode. For example, using a module designed for one reach class or wavelength plan can still light the link briefly but fail under sustained traffic due to margin erosion. In addition, some platforms expect a specific FEC mode and will show rising error counters when FEC is misaligned or when the optical budget is too tight.
Reference specs you should compare
Use the table below as a quick sanity check for common 400G direct-detect and short-reach scenarios. Always confirm the exact transceiver and cable plant specs in your vendor documentation and IEEE references.
| Optical scenario | Common transceiver type | Typical fiber type | Nominal wavelength | Reach (typical) | Connector | Operating temperature |
|---|---|---|---|---|---|---|
| 400GBASE-DR4 (short reach) | QSFP-DD 400G DR4 | OM4 multimode | ~850 nm band | Up to ~500 m (OM4, varies by vendor) | LC (MPO-to-LC breakouts vary) | Often 0 to 70 C or -5 to 70 C (check datasheet) |
| 400GBASE-FR4 (extended reach) | QSFP-DD 400G FR4 | Single-mode OS2 | ~1310 nm region | Up to ~2 km (varies by vendor) | LC or MPO (depends on vendor) | Often -5 to 70 C (check datasheet) |
| 400G coherent transport (varies widely) | Coherent pluggable | Single-mode | Varies by design | Often multi-km to tens of km (design dependent) | Varies | Varies by module |
Best-fit scenario: Use this item when the link comes up but error counters rise quickly under load, or when only one direction of traffic fails. It also applies when someone installed a “similar” optic from a different vendor family.
Pros: Prevents margin-related failures; aligns with IEEE-defined link behavior. Cons: Requires accurate knowledge of your exact port profile and optics/cable specs.

Top 4: Use DOM and optical power trends to pinpoint margin loss
DOM telemetry is your fastest “flight recorder” when you treat it like a reliability dataset rather than a one-time check. In troubleshooting, the key is to look at trends: received power drift, bias current shifts, and temperature excursions. If you only read DOM once, you may miss the moment the link crosses the vendor receiver sensitivity boundary.
What to plot and compare
- Received optical power (RX) versus time during a traffic test. A steady decline often indicates a fiber plant issue or connector aging.
- Transceiver temperature and bias current. Sudden bias changes can correlate with thermal problems or optics damage.
- Link error counters and FEC counters. Rising uncorrected errors despite stable RX suggests an optics configuration mismatch or a hardware lane issue.
Best-fit scenario: Use this item when you observe a “works yesterday, fails today” pattern without recent moves. Trend analysis often reveals gradual connector degradation or a failing transceiver.
Pro Tip: In many deployments, the most actionable DOM signal is not the absolute RX power reading, but the rate of change of RX versus temperature. A stable temperature with drifting RX strongly points to connector contamination or micro-bend loss rather than normal thermal variation.
Pros: Enables predictive troubleshooting and faster root cause. Cons: Requires monitoring access and disciplined comparison to vendor thresholds.
Top 5: Validate switch and optics configuration down to lane mapping
Configuration mismatches can create a “ghost link” where the port appears up but performance is poor. With 400G, lane mapping and breakout mode settings are especially critical: a port configured for one breakout profile can scramble lane order, causing consistent errors on specific lanes. Some platforms also require enabling the correct media type and FEC behavior for the optics model.
Practical checklist
- Confirm the port mode matches the transceiver type (for example, 400G direct attach versus breakout profiles).
- Verify FEC settings and any “autoneg” optics parameters. If your platform supports it, ensure the negotiated FEC aligns with the module’s capabilities.
- Check lane mapping and polarity settings, especially with MPO patching and breakout cables.
- Reboot only after capturing baseline counters and DOM to avoid losing correlation evidence.
Best-fit scenario: Use this item after a configuration change, automation rollout, or migration to a new switch model. It is also relevant when the link errors are consistent in one direction.
Pros: Prevents configuration-induced failures; reduces repeat outages. Cons: Some platforms limit visibility into lane-level mapping without vendor support.
Top 6: Diagnose cable loss budget with measurable attenuation accounting
In 400G networks, you cannot rely on “it should be within spec” unless you account for real attenuation: patch cords, mated connectors, splices, and any extra slack or patch panel transitions. Troubleshooting improves dramatically when you calculate the optical budget using measured or vendor-specified insertion loss values and compare against the optics vendor’s link budget assumptions.
How to build a loss budget
- Sum insertion loss for each component: patch cords, adapters, connectors, and splices. Use the vendor’s typical loss per connector and per meter.
- Include aging and worst-case margins. A connector pair can add loss over time due to micro-contamination or wear.
- Validate bend radius and cable routing changes. Add an extra margin if cables were rerouted during renovations.
Best-fit scenario: Use this item when the link only fails on certain routes, or when one patch panel span is noticeably longer than the others. It also works when DOM shows RX power near the lower acceptable threshold.
Pros: Quantifies the problem; supports change-control documentation for ISO 9001 style traceability. Cons: Requires accurate component records or measured values.
Top 7: Identify transceiver health and environmental stressors
Optics are sensitive to environment: temperature extremes, airflow restrictions, and vibration. In reliability programs, you treat transceivers like field-replaceable units with a defined failure rate profile rather than assuming “it is fine until it is not.” Troubleshooting should include environmental validation when you see recurring failures in one rack row or one aisle.
Stress checks that matter
- Confirm airflow direction and fan module performance. Measure inlet temperature at the switch and compare against the module’s operating range.
- Check for dust accumulation on vents and filters. Reduced airflow can elevate module temperature, accelerating aging.
- Look for vibration sources near the rack. In some installations, heavy HVAC cycling or nearby mechanical equipment can worsen intermittent connector issues.
Best-fit scenario: Use this item when multiple ports in the same enclosure show similar issues, or when failures correlate with specific times of day or HVAC cycles.
Pros: Reduces repeat incidents; improves MTBF by preventing premature optics stress. Cons: Requires environmental instrumentation and careful correlation.
Top 8: Troubleshooting common mistakes that waste hours
Below are frequent failure modes seen in 400G optical link troubleshooting. Each includes a root cause and a practical fix, so you can stop repeating the same unproductive steps.
Mistaking “link up” for “optical margin OK”
Root cause: The port may establish link due to initial optical power, but margin collapses under full traffic, causing CRC or FEC escalation.
Solution: Generate traffic immediately after link-up, then monitor CRC/FEC counters and RX power over time. Compare against vendor thresholds for error-free operation. Use a known-good far-end to isolate margin issues.
Cleaning once, but not verifying with microscope
Root cause: Cleaning without inspection can leave micro film or scratches, especially on MPO endfaces where geometry is unforgiving.
Solution: Inspect with a fiber microscope before and after cleaning; document results. Replace patch cords if you see core scratches or persistent film.
Swapping modules that are electrically similar but optically mismatched
Root cause: Two vendors may both label a transceiver as “400G SR/DR,” but the internal wavelength plan, lane mapping, or FEC behavior differs subtly.
Solution: Use the switch vendor’s optics compatibility list and confirm exact part numbers. If you must test third-party optics, validate with DOM and error counters under sustained load.
Ignoring bend radius and cable management changes
Root cause: A reroute that seems minor can increase loss or induce intermittent micro-bends, visible as random link flaps.
Solution: Check routing paths, confirm bend radius compliance, and re-terminate or replace cables if intermittent errors persist after cleaning and configuration verification.
Cost and ROI note: how to choose without buying repeat failures
In many enterprise and colocation environments, a 400G transceiver typically costs more than 100G optics, and the total cost of ownership depends heavily on failure frequency, downtime, and rework time. OEM optics often carry higher unit pricing but come with stronger compatibility assurance and clearer DOM threshold documentation, reducing MTTR during troubleshooting. Third-party optics can be cost-effective, but you should budget time for validation and keep a strict compatibility policy to avoid vendor lock-in surprises.
As a realistic planning range, many teams see recurring costs dominated by labor and downtime, not just the optics themselves. If you reduce failure rate by improving cleaning discipline, monitoring DOM trends, and enforcing config validation, you often recover ROI quickly by preventing repeat incidents on the same fiber routes.
Summary ranking table: fastest path to root cause
Use this ranking table during incident response. Higher score means higher likelihood and faster isolation for typical 400G optical link issues, based on common field patterns.
| Rank | Check item | Typical trigger | Speed to insight | Root-cause coverage |
|---|---|---|---|---|
| 1 | Optics chain deterministic tests | Link flaps, CRC spikes after swaps | High | High |
| 2 | Fiber cleanliness and connector inspection | Intermittent LOS, MAC-related issues | High | High |
| 3 | Match wavelength/reach/FEC expectations | Stable link but rising errors | Medium | High |
| 4 | DOM telemetry trends | Gradual degradation, time-correlated failures | Medium | Medium-High |
| 5 | Switch configuration and lane mapping | Post-change regressions | Medium | Medium |
| 6 | Cable loss budget validation | Specific routes fail, near-threshold RX | Medium | Medium |
| 7 | Transceiver health and environmental stress | Rack-local patterns, HVAC correlation | Low-Medium | Medium |
| 8 | Common mistakes triage | Repeated incidents, slow escalation | High | Medium |
[[IMAGE:Concept art style scene of a reliability dashboard floating over a data center aisle, showing a stylized 400G optical link diagram, DOM trend graphs, and warning icons for RX power drift and connector contamination, cinematic lighting, deep shadows, glowing telemetry lines, futuristic but readable]
FAQ
How do I start troubleshooting when a 400G port is up but traffic fails?
Begin with DOM and error counters while running a controlled traffic test. Then confirm optics part numbers, reach class, and FEC expectations for the port profile. If RX power is near the threshold or drifting, move to fiber inspection and loss budget checks.
What are the fastest signs that the issue is fiber cleanliness versus optics mismatch?
Fiber cleanliness issues often show intermittent behavior tied to specific patch cords or patch panels, and microscopes may reveal film or scratches. Optics mismatch often shows consistent error patterns across the same port and module pair, with behavior linked to a configuration or wavelength profile difference.
Can third-party 400G transceivers work, or is OEM required?
Third-party optics can work, but you should validate using the switch vendor compatibility list and confirm DOM thresholds and sustained error-free operation. In troubleshooting, OEM tends to reduce uncertainty because documentation is clearer and compatibility constraints are better defined.
Which standards should I reference during troubleshooting?
For Ethernet physical-layer and optical link behavior, reference IEEE Ethernet specifications relevant to your mode (for example, 400GBASE variants). Also use vendor datasheets for receiver sensitivity, DOM limits, and operating temperature ranges. [Source: IEEE 802.3].
Where do I find DOM thresholds and acceptable operating ranges?
Use the transceiver datasheet and the switch vendor’s optics documentation. If you do not have published thresholds, compare observed DOM values against vendor guidance and treat deviations as a reliability risk until validated in your environment. [Source: vendor transceiver datasheets].
What is the best way to reduce MTTR during recurring 400G incidents?
Standardize a troubleshooting runbook that starts with optics chain tests and fiber inspection, then escalates to DOM trend analysis and configuration validation. Add measured loss budget documentation and environmental checks so each incident is handled with repeatable evidence, supporting ISO 9001 style corrective action.
For reliable 400G operations, the winning strategy is evidence-driven troubleshooting: optics identification, microscope-verified cleanliness, and margin-aware validation using DOM and error counters. Next, build your own runbook around the ranking table and document outcomes with consistent measurements using related topic.
Author bio: I have deployed and troubleshot high-density 10G to 400G optical networks in production data centers, using DOM telemetry, microscopes, and repeatable acceptance tests to cut MTTR. I also design reliability-oriented workflows aligned with quality management and field return analysis.
Sources: [Source: IEEE 802.3]. [Source: vendor transceiver datasheets].