In day two operations, you typically discover signal integrity issues after packet loss, CRC spikes, or FEC failures. This article shows how to use eye diagram optical transceiver measurements to predict those failures earlier, with practical masks, test patterns, and troubleshooting steps. It helps network engineers and field technicians validate optical links in data centers and campus backbones. Update date: 2026-04-27.
Why the eye diagram is the fastest integrity signal

An eye diagram optical transceiver collapses many symbol periods into one overlay, exposing timing jitter, amplitude noise, and inter-symbol interference (ISI). For optical links, the “quality” you care about is not a single metric; it is the combination of eye opening, crossing jitter, and deterministic impairments from fiber reflections and bandwidth limits. IEEE 802.3 defines optical PHY behavior and performance expectations, while vendors publish electrical/optical interface specs and recommended test setups. In practice, engineers translate the eye into risk: a marginal eye opening often correlates with rising BER and eventual receiver sensitivity failure.
Eye analysis becomes especially valuable when you must distinguish these root causes quickly: transceiver bias drift, fiber plant issues, connector contamination, EMI coupling, and host-side electrical path problems. Instead of waiting for production traffic to degrade, you can interrogate the optical receive signal quality using a coherent or direct-detect test instrument (vendor-specific) and compare against a receiver mask or internal acceptance threshold. IEEE 802.3
Pro Tip: When you see a “wide but shallow” eye, suspect bandwidth-limited RX front-end or excessive modal dispersion rather than transmitter noise. When you see a “narrow but tall” eye, suspect timing jitter or deterministic ISI from reflections; clean and re-seat connectors before replacing modules.
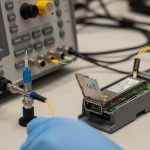
Measurement setup that produces a truthful eye
Eye diagrams only mean something if the measurement chain is calibrated and the sampling point matches the PHY’s effective decision time. Start from the PHY lane under test (single-lane for 10G/25G, per lane for 40G/100G breakout) and use a test pattern the PHY actually supports (commonly PRBS). Many “bad eyes” are artifacts: wrong reference clock alignment, uncalibrated probe loading, or a scope bandwidth that cannot reproduce the transition edges.
Step-by-step lab-to-field procedure
- Confirm link mode and rate: e.g., 10.3125G (10G Ethernet w/ 64b/66b) vs 25.78125G (25G). Mismatched rate assumptions change the eye scaling.
- Use PRBS and lock the pattern: typical choices are PRBS31/PRBS7 depending on PHY; verify lock before capturing.
- Calibrate instrumentation: apply scope/channel deskew, ensure the probe/sampler bandwidth exceeds the Nyquist requirement for the data rate.
- Match the capture point: if measuring after an external optical-to-electrical conversion, account for that converter’s bandwidth and group delay.
- Run multiple captures: capture at least 10 segments and compare variability; random jitter will show up as eye wander and crossing distribution changes.
Key specs to record with every eye capture
- Transceiver part number and revision (including vendor)
- Optical wavelength and link budget assumptions
- Receiver type (PIN vs APD where applicable)
- DOM values: TX bias, RX power, temperature
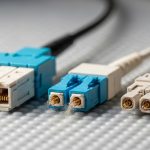
- Fiber type: SMF vs MMF, core/cladding, patch length, number of connectors
- Connector cleanliness and inspection result (pass/fail)
Interpreting eye metrics into actionable pass or fail
Engineers often ask, “What should I see?” The answer depends on the measurement standard and receiver mask. Many optics vendors and PHY test guides provide an eye mask concept (a compliance region the eye must meet) rather than a single universal eye height. Your practical workflow is to extract these metrics: eye height, eye width (opening), crossing jitter, and ISI-induced closure. Then compare against the acceptance thresholds derived from the PHY BER requirements and the vendor’s receiver sensitivity curve.
Common eye diagram behaviors and likely causes
- Reduced eye height: receiver input power too low, excessive fiber loss, dirty connectors, or aging laser bias.
- Reduced eye width: clock/data recovery issues, deterministic jitter from reflections, or host-side equalization mismatch.
- Eye “tilt”: coupling of frequency-dependent response; can indicate bandwidth mismatch in the electrical path or optical-to-electrical conversion path.
- Ringing: probe mismatch or reflections in the electrical measurement chain; in production, reflections often trace to fiber connector geometry or improper patching.
Reference comparison: typical short-reach optics and what they imply for eyes
Different link distances and modulation formats produce different eye characteristics. The table below summarizes representative direct-detect short-reach modules commonly found in enterprise and data center designs; use it as a baseline for expectations, not as a guarantee.
| Module class | Example part numbers | Nominal wavelength | Reach (typ.) | Connector | Typical eye risk factors | Operating temp (typ.) |
|---|---|---|---|---|---|---|
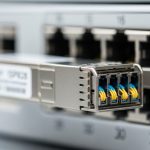
| 10G SR (direct-detect) | Cisco SFP-10G-SR, Finisar FTLX8571D3BCL | 850 nm | ~300 m on OM3 / ~400 m on OM4 | LC | Modal dispersion, patch-cord quality, connector cleanliness | 0 to 70 C |
| 10G SR (extended variants) | FS.com SFP-10GSR-85 (example family) | 850 nm | ~400 m on OM4 (varies by vendor) | LC | More sensitivity to excess loss and patch length | -5 to 70 C (varies) |
| 25G SR (direct-detect) | Common SFP28 SR families (vendor-dependent) | 850 nm | ~100 m on OM3 / ~150 m on OM4 (typ.) | LC | Higher equalization demands; tighter budget | 0 to 70 C |
| 100G SR4 (direct-detect, lane-based) | QSFP28 SR4 families (vendor-dependent) | ~850 nm (multi-lane) | ~100 m on OM4 (typ.) | MPO/MTP | Lane skew, MPO polarity, differential patch loss | 0 to 70 C |
As rate increases, the eye often closes faster with the same plant damage because the receiver bandwidth and equalization have finite capability. That is why the same fiber closet problem (for example one contaminated MPO lane) can be invisible at 10G but catastrophic at 100G.
Selection criteria checklist for optics that preserve eye margin
When you choose optics, you are choosing the system margin that ultimately shapes the eye diagram optical transceiver you will observe at the receiver. Use this ordered checklist during procurement and during link bring-up.
- Distance vs validated reach: confirm exceedance risk with measured end-to-end loss (not just vendor spec). Include worst-case patch length and connector count.
- Budget math with aging: apply conservative margins for temperature rise and component aging; track historical DOM drift per link.
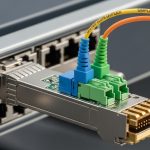
- Switch compatibility and lane mapping: verify exact vendor transceiver compatibility lists for your switch model; lane reversal can create systematic eye closure in QSFP28 SR4.
- DOM support and telemetry quality: check whether DOM reports TX bias current, RX power, and temperature with the expected units and update intervals; poor DOM can delay diagnosis.
- Operating temperature range: ensure module temperature stays within spec at peak airflow; high temperature can increase noise and shift laser bias.
- Connector and fiber plant constraints: enforce IEC-style connector inspection pass criteria (scope-based) and verify polarity for MPO trunks.
- Vendor lock-in risk: third-party optics can work, but you must validate with the exact switch firmware and optics compatibility policies; track RMA rates and failure patterns.
Common mistakes and troubleshooting playbook
Below are failure modes that field teams repeatedly encounter. Each includes root cause and a targeted fix. Capture evidence (DOM readings, scope screenshots, and OTDR/optical power logs) before swapping parts to avoid masking the real cause.
“The eye is bad” but the measurement chain is wrong
- Root cause: scope/probe bandwidth too low, missing deskew, or wrong trigger reference; leads to artificial inter-symbol ringing and a falsely reduced eye width.
- Solution: verify scope bandwidth exceeds the data rate requirements; run a known-good reference link; perform channel calibration and deskew; confirm PRBS lock before capture.
Dirty connectors that specifically collapse the eye height
- Root cause: contamination at LC or MPO interfaces increases insertion loss and can induce mode-dependent effects, reducing receiver margin and shrinking eye opening.
- Solution: inspect with a fiber microscope, clean using lint-free methods, then re-measure RX power and eye height. For MPO, validate polarity and ensure proper keying and seating.
Reflection-driven jitter that narrows eye width
- Root cause: reflections from poorly seated connectors, damaged fiber endfaces, or mismatched patch-cord geometry create deterministic jitter and ISI, producing eye closure near the crossing time.
- Solution: re-seat and clean both ends, replace suspect patch cords, and if available run OTDR or reflectometry to localize event locations. Re-test after each change and compare crossing jitter distribution consistency.
DOM drift ignored during thermal transients
- Root cause: laser bias current or temperature changes during airflow variations; the eye degrades only under peak temperature, causing “intermittent” production faults.
- Solution: log DOM at 1-minute cadence (or faster if platform supports) during controlled thermal conditions; correlate RX power and TX bias with error counters (BER/FER/FEC).
Cost and ROI: what eye-based validation changes in TCO
Optics pricing varies by vendor and speed class. In typical enterprise purchasing, a third-party 10G SR SFP+ can be in the $20 to $60 range, while OEM-branded modules may land at $80 to $150 depending on contract pricing; higher-rate QSFP28/CFP2 optics can be materially higher. The ROI lever is not the module cost alone; it is failure avoidance and faster mean time to repair by pinpointing whether the issue is optical power, jitter, or plant loss.
Eye-based validation reduces TCO by preventing unnecessary swaps and by catching marginal links before they trigger costly outages. In one common operations pattern, teams that log DOM and capture eye metrics during maintenance windows reduce repeat RMA cycles and shorten troubleshooting from days to hours by avoiding blind part replacement. However, note limitations: many scopes and optical test setups cannot directly produce a PHY-equivalent compliance mask unless the vendor provides the mapping between measured eye metrics and BER/FER targets.
FAQ
What is an eye diagram optical transceiver measurement used for in production?
It is used to evaluate timing jitter and amplitude integrity at the receiver sampling point. In production, teams use it to validate marginal links, confirm the effect of cleaning or patch changes, and correlate eye closure with error counters like BER/FER.
Can I compare eye diagrams across different vendors’ optics?
Only with caution. The same eye “shape” can map to different BER depending on modulation format, receiver sensitivity, and equalization behavior. Compare using the same test setup and, ideally, the vendor-provided acceptance mask or BER-to-eye mapping.
How do DOM readings relate to eye height and jitter?
DOM RX power and TX bias current strongly correlate with eye height because insufficient optical power reduces signal margin. DOM temperature can correlate with both noise and jitter through laser bias drift and receiver sensitivity variation, especially during thermal transients.
What should I do first when eye width suddenly collapses?
First check for deterministic impairments: connector re-seating, polarity correctness for MPO/MTP, and patch cord replacement. Next validate that the measurement chain is stable (deskew, PRBS lock, sampling alignment) and that the host switch lane mapping did not change.
Does eye diagram analysis replace BER testing?
No. Eye diagrams are a diagnostic tool that accelerates root cause isolation, but BER/FER testing is still the compliance ground truth. Use eye analysis to decide where to focus, then confirm with BER/FER under representative traffic conditions.
What test pattern should I use for best repeatability?
Use PRBS patterns supported by your PHY and confirm lock before capture. For repeatability, keep the same pattern, rate, and temperature conditions across captures so crossing jitter and eye wander are comparable.
Eye diagram optical transceiver analysis turns opaque link failures into measurable integrity signals you can act on. Next step: review the related checklist for optical plant readiness using fiber connector cleaning and inspection for optical links and align it with your eye-metric findings.
Author bio: Field-focused network performance engineer specializing in optical PHY validation, DOM telemetry correlation, and scope-based signal integrity troubleshooting in data center deployments. Previously supported multi-vendor transceiver interoperability programs across 10G to 100G platforms.