In a busy switching closet or leaf-spine data center, a hot-pluggable transceiver can look fine while telemetry quietly fails. This guide helps you install and configure optical modules with DOM monitoring, so you can verify link health using vendor-accurate readings. It is aimed at network engineers and field technicians deploying 1G to 10G optics in production, where downtime and misreads are costly.
Why DOM monitoring matters right after you insert a module

Digital Optical Monitoring (DOM) exposes real-time telemetry from the transceiver: transmit power, receive power, bias current, temperature, and sometimes laser diagnostics. On IEEE-aligned platforms, the management plane reads this data via the module’s management interface, enabling faster root-cause during link flaps or link margin issues. In practice, DOM monitoring is the fastest way to distinguish “bad fiber” from “aging laser” from “thermal stress” after a hot swap.
For standards context, look for support consistent with IEEE 802.3 and vendor transceiver management documentation. For transceiver DOM register behavior and diagnostics, verify the vendor datasheet for your exact optics part number. [Source: IEEE 802.3 standard] [Source: Cisco transceiver documentation]
Pro Tip: Many teams log DOM telemetry at the first 60 seconds after insertion. If temperature spikes or RX power is already below threshold at t=0, you likely have a connector/fiber polarity or cleaning issue rather than a slow optical aging problem.
DOM monitoring specs you must match to your network
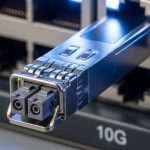
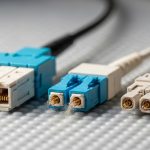
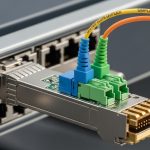
Before inserting a module, confirm the physical interface and electrical expectations of both ends. DOM monitoring depends on the module type (SFP, SFP+, QSFP, QSFP28) and the host’s DOM implementation. A mismatch can still “link up” while telemetry is missing or misleading.
Quick comparison table: common 10G SR optics with DOM
Use this table to sanity-check the basics before you trust telemetry for alarms and thresholds.
| Module example | Data rate | Wavelength | Reach (typ.) | Connector | DOM monitoring | Operating temp. | Typical use |
|---|---|---|---|---|---|---|---|
| Cisco SFP-10G-SR | 10G | 850 nm | 300 m OM3 / 400 m OM4 | LC | Supported (temperature, power, bias) | 0 to 70 C (verify SKU) | ToR and aggregation |
| Finisar FTLX8571D3BCL | 10G | 850 nm | 300 m OM3 / 400 m OM4 | LC | Supported (per datasheet) | 0 to 70 C (verify) | Enterprise switching |
| FS.com SFP-10GSR-85 | 10G | 850 nm | 300 m OM3 / 550 m OM4 | LC | Supported (per datasheet) | 0 to 70 C (verify) | Cost-optimized deployments |
Always confirm the exact DOM feature set (some vendors expose additional diagnostics) and the host switch’s behavior for threshold alarms. [Source: vendor transceiver datasheets] [Source: ANSI/TIA cabling guidance]
Hot-pluggable install steps that keep DOM monitoring trustworthy
Follow a repeatable workflow so your first telemetry sample is meaningful and comparable across swaps. In the field, the biggest DOM problems usually come from physical handling, connector contamination, or host compatibility quirks.
Step-by-step procedure
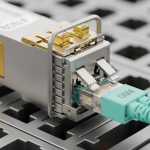
- Pre-check compatibility: confirm the module form factor and speed (SFP vs SFP+), and verify the host supports DOM for that SKU family.
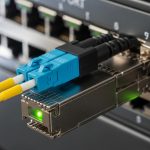
- Inspect and clean fiber ends: use an end-face inspection scope and clean with lint-free wipes and approved cleaning method. Even a small haze can reduce RX power enough to trigger errors.
- Check polarity: for SR modules using LC, ensure transmit goes to receive on the opposite side (use labeled patch panels if available).
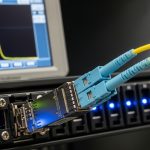
- Insert module gently: avoid touching the optical windows. Seat fully until the latch clicks.
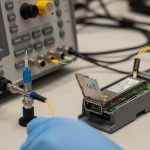
- Wait for link settle: monitor interface state and read DOM telemetry within the first minute. Capture values for temperature, TX power, and RX power.
- Set thresholds (if supported): configure alarms based on your vendor’s DOM interpretation and your optics budget. Do not copy thresholds blindly from another module family.
- Record for audits: log module part number, serial number (if available), and DOM snapshot so you can correlate future link degradations.
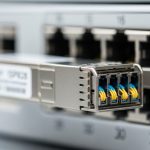
Deployment scenario: leaf-spine with 48-port ToR switches
In a 3-tier data center leaf-spine topology with 48-port 10G ToR switches, each leaf has 40 server-facing links and 8 uplinks. During a maintenance window, a technician hot-swaps a failed optics module on an uplink and immediately checks DOM monitoring for the replacement. The engineer expects temperature to stabilize within a few degrees after insertion, and RX power to fall within the link budget range for OM4 at 400 m. If RX power is already low at t=0, the team re-cleans the LC connectors rather than assuming the new module is defective.
This workflow reduces mean time to repair because DOM telemetry narrows root cause to optics vs cabling. It also supports capacity planning: repeated DOM trends can flag degrading fibers or patch panel issues before CRC errors spike.
Selection criteria checklist for DOM monitoring compatibility
When choosing modules and planning monitoring, engineers typically weigh these factors in order:
- Distance and media: verify OM3/OM4 type, expected reach, and link margin for 850 nm optics.
- Switch compatibility: confirm the host model and port type accept the module family without DOM read issues.
- DOM register support: ensure the switch can read temperature and power fields; confirm alarm thresholds map correctly.
- Operating temperature: confirm the module spec matches the switch’s actual airflow and ambient conditions.
- Budget and procurement: compare OEM vs third-party while planning for validation effort and potential RMA patterns.
- Vendor lock-in risk: evaluate whether you can standardize on a module family across multiple switch vendors.
- Documentation availability: require datasheets with DOM diagnostics descriptions and known host behaviors.
Common mistakes and troubleshooting tips (with root cause)
DOM monitoring failures are often misdiagnosed. Here are field-proven failure modes and fixes.
-
Mistake: Assuming “link up” means telemetry is correct.
Root cause: some hosts display interface up while DOM reads fail or return zeros/invalid ranges.
Fix: query the switch’s optics DOM page immediately after insertion; verify non-zero TX/RX power and temperature values. -
Mistake: Skipping fiber inspection during hot swap.
Root cause: connector contamination can drop RX power enough to cause CRC errors, while TX appears normal.
Fix: inspect and clean LC ends; re-seat patch cords; confirm polarity before replacing optics again. -
Mistake: Using thresholds copied from a different module SKU.
Root cause: DOM interpretation and expected optical ranges vary by vendor and reach class.
Fix: pull the vendor’s DOM diagnostics guidance; set alarms to your measured baseline after installation. -
Mistake: Running modules outside thermal envelope.
Root cause: blocked airflow or dense bundles can increase temperature, pushing lasers toward instability.
Fix: check airflow paths, cable management, and confirm module temperature stabilizes after insertion.
Cost and ROI note: what DOM monitoring changes in TCO
OEM optics often cost more upfront than third-party modules, but DOM monitoring can reduce labor and downtime costs by accelerating diagnosis. In many networks, a validated third-party module can be 20% to 40% cheaper per unit, yet still requires initial compatibility testing and ongoing RMA tracking. The ROI comes from fewer repeat visits: if DOM monitoring cuts troubleshooting time from hours to minutes, the payback is usually immediate during incident response.
For TCO, include: validation time, cleaning supplies, inspection scope usage, spares strategy, and the operational cost of false alarms caused by misconfigured thresholds.
FAQ
What does DOM monitoring actually show on my switch?
Most SFP/SFP+ and QSFP platforms expose temperature and optical power telemetry. Depending on the vendor, you may also see bias current and diagnostic flags. Check your switch’s optics or transceiver diagnostics command output and compare it to the module datasheet fields. IEEE 802.3
Can I hot-swap optics and keep DOM monitoring uninterrupted?
You can hot-swap safely if the host supports hot-plug for that port type and the transceiver is compatible. DOM telemetry will update after insertion, but alarms may trigger briefly during link renegotiation. Capture a baseline snapshot within the first minute to confirm stable readings.
Why would DOM monitoring show weird values right after insertion?
Common causes include connector contamination, incorrect polarity, or a host that does not fully support that module’s diagnostic interpretation. Validate that TX/RX power and temperature fall within a plausible range for the module class. If values are invalid or missing, confirm module compatibility with the exact host model.
Do third-party optics always support DOM monitoring?
Many do, but support quality varies by host vendor and transceiver family. Some environments read DOM fields correctly while others have limited diagnostics. Plan a pilot with the exact switch model, then standardize only after you confirm telemetry and alarms behave as expected.
How should I set DOM alarm thresholds?
Use the vendor’s recommended diagnostic ranges and then calibrate using your measured baseline after installation. Start with conservative thresholds that catch real drift without creating noisy alerts. Revisit thresholds after major cabling changes or when you swap to a different module SKU.
What is the fastest troubleshooting path when links flap?
First, check interface counters and read DOM monitoring immediately. If RX power is low or rising erratically, inspect and clean connectors and confirm polarity before replacing optics. If optical power is stable but errors persist, then check switch port settings, speed/encoding negotiation, and patch panel routing.
With a disciplined hot-plug workflow and immediate DOM monitoring validation, you can turn optics incidents into quick, data-backed fixes. Next, review fiber optic connector cleaning best practices to prevent the most common root cause: dirty LC ends.
Author bio: Field engineer turned network architect, focused on real-world optics telemetry and operational reliability. I write deployment checklists that match how equipment behaves in production outages and maintenance windows.