When a 10G fiber link starts flapping, most teams chase switch ports and patch cords first, then discover the optics were aging quietly. This article walks through a real deployment case where we standardized DDM DOM optical transceiver validation, alarm thresholds, and environmental fit to reduce outages and shorten troubleshooting time. It helps network reliability engineers, field technicians, and facilities teams who must meet service targets while keeping OPEX under control.
Problem and challenge: “Link up/down” without clear root cause

In a regional enterprise network, we had a recurring pattern: access-to-core 10G SFP+ links would intermittently drop, but switch port counters alone did not reveal a single dominant culprit. Over six weeks, the operations team logged 14 link events across 22 10G SFP+ uplinks, with typical recovery times of 12 to 25 minutes. We needed a process that could detect optical degradation early, correlate it with environmental conditions, and prove whether the transceivers were approaching failure.
Our starting hypothesis was that some optics were operating near temperature limits and that aging lasers or marginal fiber conditions were pushing the transceivers toward out-of-spec behavior. However, without optical diagnostics, we could not confidently separate “bad fiber/connector” from “aging module.” We decided to standardize monitoring using DDM/DOM metrics exposed by the transceiver so the evidence would be actionable.
Environment specs: how the transceivers were actually used
We deployed 10G links in a 3-tier topology: 48-port ToR switches feeding aggregation, then core. The specific links used 10GBASE-SR over multimode fiber in equipment rooms with variable airflow. During peak summer, ambient rack temperature ran from 28 C to 38 C, and we measured front-to-back temperature gradients of about 6 C within the same rack.
Fiber plant included both MPO-based patching and LC fanouts, with patch cords ranging from 3 m to 12 m. We also saw occasional connector cleaning delays after maintenance. On the electrical side, the switches supported SFP+ with vendor-agnostic optics, but we still had to validate DOM/DDM behavior and alarm reporting.
Technical specifications we validated
Below are representative optics specs we used to set expectations for power, reach, and diagnostic readings. Actual values vary by vendor and part number, so always confirm against the vendor datasheet and the switch compatibility matrix.
| Parameter | Example module class | What we checked in the field |
|---|---|---|
| Data rate | 10G SFP+ | Link training stability; no overspeed behavior |
| Wavelength | ~850 nm (SR) | Consistent optical power and received power |
| Connector | LC (or MPO to LC fanout) | DOM/DDM readings correlate with cleaning events |
| Reach (MM) | Up to 300 m (OM3) / 400 m (OM4) | Power budget margin vs. measured Tx/Rx |
| DDM/DOM metrics | Tx bias, Tx power, Rx power, temp, supply | Alarm thresholds and trends over weeks |
| Operating temp | 0 C to 70 C (typical) | Rack temps and transceiver temperature stability |
| Power class | ~0.3 W to 1.5 W (module-dependent) | Supply stability; avoid marginal power rails |
Chosen solution: using DDM DOM optical transceiver metrics as a reliability control
We selected compliant 10G SFP+ optics that expose standard DDM/DOM registers via the SFP management interface so our monitoring system could read and alarm on them. In parallel, we aligned with IEEE transceiver expectations and vendor guidance for digital diagnostics; the operational goal was not just “read values,” but to act on trends.
We also standardized part sourcing to reduce variability. In the lab and in staging, we tested modules such as Cisco-compatible 10GBASE-SR SFP+ classes and third-party optics with known DOM support (for example, optics similar to Finisar FTLX8571D3BCL style SR modules and FS.com SR SFP-10GSR-85 class optics). Compatibility can differ by switch and firmware, so we treated switch-port acceptance testing as a required step.
Pro Tip: Many teams alert only on “DOM alarm present.” In practice, the earlier signal is the trend of Rx power and Tx bias current: a slow Rx power decline (with stable temperature) often points to fiber/connectors loss growth, while a Tx bias drift (with rising module temperature) often points to aging or thermal stress.
Implementation steps we used in the field
- Baseline readings: For each link, we captured initial Tx bias, Tx power, Rx power, temperature, and supply over 48 hours after installation.
- Set thresholds with guard bands: We used vendor-recommended alarm limits as a starting point, then added a “pre-fail” window using change rate (for example, Rx power dropping by a consistent margin over several days).
- Correlate with environmental logs: We linked transceiver temperature to rack inlet/outlet temperature and airflow events so we could separate thermal causes from fiber causes.
- Perform cleaning before replacement: If Rx power trended downward without a Tx bias surge, we cleaned connectors and remeasured before swapping optics.
- Track MTBF drivers: We tagged each incident with likely root cause (thermal, fiber loss, connector contamination, or optics aging) to improve our spares strategy.
Measured results: uptime improvement with fewer “blind” swaps
After deploying the monitoring rules and the process changes, we saw a clear reduction in link events. Across the next quarter, we recorded 4 link events affecting the same uplink group, compared with 14 events in the prior six-week window. Mean time to resolution dropped from 12 to 25 minutes to 6 to 14 minutes because the optics diagnostics narrowed the search to either fiber loss growth or thermal/aging behavior.
We also reduced unnecessary module replacements. Of the four events, two were resolved via connector cleaning and patch cord re-termination after Rx power indicated elevated loss growth while temperature and Tx bias stayed within stable ranges. The other two events involved optics that showed a combination of rising Tx bias and temperature excursions, leading to proactive replacement during a planned maintenance window.
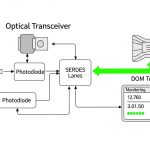
What the DDM DOM data looked like operationally
In our dashboard, each transceiver produced a time series for the core diagnostics: module temperature, Tx bias current, Tx output power, and Rx received power. We used those signals to trigger actions: clean and re-test, reseat optics, or schedule replacement. Importantly, we documented the exact alarm thresholds and the action mapping so technicians could follow the same decision tree consistently.
Selection criteria checklist for DDM DOM optical transceiver deployments
Not all DOM/DDM implementations behave identically across vendors, and switch firmware may interpret alarms differently. Use this ordered checklist to reduce surprises during rollout.
- Distance and fiber type: Confirm reach targets against OM3/OM4 specs and your measured link budget margin.
- Switch compatibility: Verify the switch model and firmware support for the transceiver type; test in staging if possible.
- DOM/DDM feature coverage: Ensure it reports Tx bias, Tx power, Rx power, temperature, and supply; confirm address map and scaling in monitoring.
- DOM alarm behavior: Check whether alarms trigger at the expected thresholds and how the switch surfaces them (event counters, syslog, SNMP, or internal diagnostics).
- Operating temperature fit: Match the module temperature range to rack conditions; consider worst-case airflow restrictions.
- Vendor lock-in risk: If you must source from one OEM, negotiate pricing and warranty; otherwise validate third-party DOM support to avoid blind monitoring.
- Quality and reliability evidence: Prefer vendors that provide datasheets with diagnostic specs and clear compliance statements; plan for burn-in if your risk tolerance requires it.
Common pitfalls and troubleshooting tips
Below are field failure modes we encountered or frequently see when teams adopt a DDM DOM optical transceiver monitoring program.
Alarm present, but root cause is fiber loss not optics failure
Root cause: Connector contamination or damaged patch cords increases attenuation, lowering Rx power while Tx bias remains stable. DOM/DDM alarms may look like optic failure, leading to unnecessary replacements.
Solution: Clean connectors using proper fiber cleaning tools, inspect under magnification, then remeasure Rx power. Only replace optics if Tx bias or temperature trends indicate aging or thermal stress.
False positives from temperature swings and poor airflow
Root cause: Rack fans failing or blocked vents cause module temperature excursions; some transceivers report temperature drift that triggers alarms during non-fault conditions.
Solution: Correlate DOM temperature with rack sensor data. Adjust pre-fail thresholds using change rate and require alarm persistence across multiple sampling intervals.
Monitoring mismatch due to scaling/interpretation differences
Root cause: Different vendors can scale diagnostic values or implement register behaviors slightly differently, so the monitoring system may interpret raw readings incorrectly.
Solution: Validate your parser against a known-good module in staging. Confirm units and conversion factors, and document the mapping for each transceiver type.
Switch rejects optics or limits diagnostics visibility
Root cause: Some switch models accept link but suppress DOM events, or they apply stricter optics qualification than expected.
Solution: Confirm “DOM visible” in the switch management plane (CLI/SNMP). If diagnostics are missing, you may still get link but lose the reliability benefit.
Cost and ROI note: where the savings really come from
Typical 10GBASE-SR SFP+ optics pricing varies widely by vendor and warranty terms. In many enterprise procurement cycles, OEM modules may cost roughly two to three times third-party options, but third-party modules with full DOM support can still be cost-effective when they reduce downtime and shorten troubleshooting.
Our ROI came from three levers: fewer incidents, fewer truck rolls, and less “guess-and-replace.” Even if a third-party module is cheaper upfront, the total cost of ownership can rise if diagnostics are incomplete or if incompatibility causes repeated replacements. We treated DOM/DDM coverage as part of the reliability cost model, not a nice-to-have.
For planning, estimate MTBF impact by incident frequency, not only vendor MTBF claims. If your network has monthly link-impacting events, reducing event count by even 60 to 80 percent can justify the time spent on monitoring validation quickly.
FAQ
What does DDM DOM optical transceiver monitoring actually measure?
Digital diagnostics typically provides module temperature, supply voltage (or an equivalent), transmitter bias current, transmitted optical power, and received optical power. The exact register mapping and scaling come from the transceiver implementation, so validate units in staging. [Source: IEEE 802.3 clause guidance on optical transceiver management expectations]
Will DDM DOM work the same on every switch?
Most SFP+ platforms can read standard diagnostic fields, but alarm presentation and scaling can differ by switch model and firmware. Always test the specific switch version you run in production and confirm the diagnostics are visible in your telemetry path. [Source: Cisco SFP+ documentation and vendor switch management guides]
How do I set alarm thresholds without causing noise?
Start from vendor alarm limits for hard faults, then add “pre-fail” thresholds based on trend rate rather than single spikes. Require persistence across multiple sampling intervals and correlate with temperature and environmental events. This reduces nuisance alerts during normal thermal cycling.
Is it worth buying OEM optics for better diagnostics?
OEM optics can reduce compatibility risk and often come with clearer warranty and support paths. However, third-party DDM DOM optical transceiver modules can perform well if they fully support diagnostics and pass your staging tests. The decision should factor total incident cost, not only unit price.
What should I check first when Rx power keeps dropping?
First, inspect and clean connectors, then reseat optics and verify patch cord quality. If Tx bias rises concurrently with temperature, suspect aging or thermal stress; if only Rx power drops with stable Tx bias, suspect fiber loss growth. Use DOM trend charts to separate these cases quickly.
How can I prove reliability improvement to stakeholders?
Track incident count, mean time to resolution, and replacement actions before and after implementing DOM-based workflows. Include environmental correlation and show how diagnostics reduced blind swaps. Reliability reporting is most persuasive when it ties directly to operational metrics.
By treating DDM DOM optical transceiver diagnostics as a reliability control—complete with thresholds, environmental correlation, and a consistent technician decision tree—you can reduce link events and shorten troubleshooting time. Next, review DDM DOM monitoring best practices to standardize your telemetry, alerting logic, and acceptance testing.
Author bio: I am a field reliability engineer who has deployed fiber networks across mixed-vendor optics, focusing on ISO-aligned quality processes, MTBF-driven maintenance, and environmental risk control.
Author bio: I write practical monitoring playbooks that translate transceiver diagnostics into measurable uptime outcomes for real operations teams.