In a busy data center, a “working” fiber link can still degrade before it fails—through micro-bends, dirty connectors, or marginal optics. This article helps network and facilities teams apply link optimization as a maintenance discipline, not just a one-time install task. You will get a step-by-step workflow, the specs that matter, and troubleshooting methods you can run during scheduled maintenance windows.
Prerequisites for reliable link optimization in fiber networks
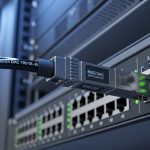
Before you touch transceivers or patch panels, confirm you have the right measurement tools and access. For most 10G and 25G/40G/100G deployments, you need an optical power meter and stable reference adapters, plus a fiber inspection scope sized for your connector type. If you also plan to validate optics health, ensure your switch platform supports digital diagnostics (DOM) and that you can read alarms through the vendor CLI or management plane.
What to prepare (minimum viable toolkit)
- Optical test equipment: power meter and calibrated light source or an OTDR appropriate for your fiber type (SMF or OM4/OM5).
- Connector inspection: end-face microscope for LC/SC/MPO, with documented cleaning guidance.
- Cleaning supplies: lint-free wipes, appropriate IPA, and/or pre-saturated cleaning pads; for MPO, use the correct polarity-safe cleaning method.
- Transceiver diagnostics: DOM read capability on your switches or a transceiver monitoring tool.
- Documentation: as-built fiber maps, port labeling standard, and a change ticket template for maintenance records.
Operational guardrails
Establish a baseline measurement policy: record received power (Rx) and transmit power (Tx) at install time, then repeat after any cleaning, re-termination, or patch move. Define pass/fail thresholds based on your link budget and vendor recommendations, not only on “it links up.” For reliability work, treat cleanliness, alignment, and optical margin as first-class maintenance targets.

Step-by-step implementation: link optimization maintenance workflow
Use this numbered process during scheduled maintenance or after any physical change. The goal is to optimize the link margin so the system stays stable under temperature swings, patch churn, and aging optics. This workflow works across SFP+, SFP28, QSFP+, QSFP28, and similar digital optical modules, as long as DOM is accessible.
Inventory optics and capture DOM baselines
Start by exporting DOM data for the transceivers on the affected paths. Collect laser bias current, laser output power, receiver power, module temperature, and any vendor-defined warning or alarm flags. Record the values alongside switch port, transceiver part number, serial number, and firmware version. If your platform supports it, also record optical diagnostics such as Rx power in dBm and any “link degradation” events.
Expected outcome: a baseline table showing typical Rx power and temperature behavior for each link, with no unexplained alarms.
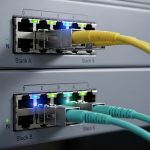
Verify physical path and polarity before measuring optics
Confirm the fiber route matches the documented map. For duplex links, verify Tx/Rx polarity and that patch cords are not crossed. For MPO-based arrays, confirm polarity using the correct MPO trunk-to-breakout orientation method for your system design. Measure only after the physical path is verified, because polarity mistakes can produce misleading power readings and intermittent link symptoms.
Expected outcome: a validated fiber path with correct polarity and consistent labeling.
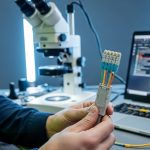
Inspect and clean connectors using the connector type rules
Use the inspection scope to check every connector on both ends of the link. If you see contamination, clean in the order recommended by the connector vendor and module manufacturer. For high-density panels, do not assume “factory clean” remains clean after multiple patch cycles; contamination is a common root cause of Rx power drift.
Expected outcome: verified connector end-faces that show no visible debris, scratches, or haze.
Measure optical power and compare to the loss budget
Measure Tx and Rx power at the switch ports using calibrated adapters and reference cables. Then compute margin against your expected link budget. For example, a typical 10G SR over OM4 scenario often has a designed budget that tolerates connector and splice loss, but real margin shrinks quickly when patch cords are reworked.
Expected outcome: Rx power within vendor-recommended operating range with a margin suitable for your link class.
Validate with BER or link stability checks
Do not rely on link up/down alone. If your transceivers or switches support it, check error counters (CRC, FEC if applicable, or vendor-specific optical metrics). Run a controlled traffic test at line rate for a defined interval—commonly 15 to 60 minutes during maintenance windows—then re-check DOM and error counters.
Expected outcome: stable forwarding with no rising error counters and no DOM warnings.
Record results and set a recurring maintenance schedule
Update the ticket with: DOM baseline values, measured Rx power, cleaning actions performed, connector inspection results, and pass/fail thresholds. Establish a cadence based on churn: links in high-move environments (new racks, frequent patching) should be inspected more often than stable backbones. Use the recorded data to predict when a module may approach its aging limits.
Expected outcome: a traceable record that enables faster future interventions and reduces mean time to repair.

Key optics specifications that drive link optimization decisions
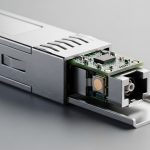
Link optimization is constrained by the transceiver’s optical parameters and the fiber’s performance class. The most operationally relevant values are wavelength, reach, typical and maximum power behavior, connector type, and temperature range. For reliability work, also track DOM compliance so you can detect drift before it causes outages.
Common module types and practical spec points
| Module type example | Wavelength | Typical reach | Connector | DOM support | Temperature range | Notes for link optimization |
|---|---|---|---|---|---|---|
| SFP-10G-SR (example: Cisco SFP-10G-SR) | 850 nm | Up to ~300 m on OM3; up to ~400 m on OM4 (depends on system budget) | LC duplex | Yes (vendor digital diagnostics) | Typically commercial grade or extended depending on SKU | Rx power margin can shrink fast with dirty LC ends and repeated patching |
| SFP+ / SFP28 1310 nm LR (example: Finisar FTLX8571D3BCL) | 1310 nm | Up to ~10 km over SMF (model dependent) | LC duplex | Yes | Varies by grade | OTDR verification helps isolate splice loss and micro-bends along the route |
| QSFP28 100G SR4 (example: FS.com SFP-10GSR-85 is analogous for SR optics class) | ~850 nm (multi-lane) | ~100 m on OM4 typical class targets (system budget dependent) | MPO/MTP (array) | Yes | Varies by SKU | MPO polarity and end-face cleanliness dominate stability; verify lane alignment if supported |
Tip: always confirm the exact transceiver model number and DOM capability from the vendor datasheet for the specific SKU you deploy. [Source: IEEE 802.3 (Ethernet physical layer specifications)] [[EXT:https://standards.ieee.org/standard/]]
Pro Tip: In practice, the fastest predictor of future failures is not link speed, but the slope of Rx power change across maintenance cycles. If you see a consistent drop after “minor” patch adjustments, treat it as an indicator of connector wear or repeatedly re-contaminated end-faces, even when the link remains up.

Selection criteria checklist for link optimization and maintenance readiness
Engineers choose optics and procedures based on operational constraints. Use this ordered checklist to reduce surprises during maintenance and to minimize vendor lock-in risk.
- Distance and loss budget: confirm your planned reach versus worst-case margins, including patch cord length and expected connector/splice loss.
- Switch compatibility: verify the transceiver is supported by the switch model and firmware for both electrical and optical behavior.
- DOM support and alarm granularity: ensure you can read Rx power, temperature, and threshold alarms for proactive maintenance.
- Operating temperature range: match module grade to your environment; hot aisles and direct airflow blockage can push temperature near limits.
- Connector type and cleaning access: LC and MPO behave differently; ensure your maintenance process fits the panel density and connector geometry.
- DOM thresholds and monitoring tooling: confirm your monitoring system can ingest DOM values and correlate them with events and tickets.
- Vendor lock-in risk: evaluate OEM versus third-party optics with comparable DOM behavior; plan for spares that are interchangeable in your validated list.
Expected outcome: a maintained link that stays within margin and is observable enough to support predictive actions.
Common mistakes and troubleshooting tips for fiber link optimization
Most “mystery” outages are traceable to a small set of physical and monitoring failures. Use these failure modes as your first triage path.
Mistake: measuring before validating polarity
Root cause: crossed duplex fibers or incorrect MPO polarity can yield low or unstable Rx power and intermittent errors. The link may come up in some cases but fail under traffic bursts. Solution: verify Tx/Rx orientation against the fiber map, and for MPO confirm polarity method before re-measuring power.
Mistake: assuming a cleaned connector stays clean
Root cause: connector end-faces re-contaminate quickly when patch cords are handled in high-dust environments or repeatedly unplugged. This often shows up as gradual Rx power drift rather than a sudden outage. Solution: inspect immediately before mating, clean with the correct method, and document the inspection result in the ticket.
Mistake: ignoring DOM warnings and focusing only on link state
Root cause: optics can show rising temperature or biased laser current while the interface still reports “up.” Over time, this reduces margin and increases error counters. Solution: set alert thresholds for DOM parameters you can read (Rx power, temperature, laser bias) and correlate them with error counter trends.
Mistake: using uncalibrated adapters or inconsistent reference points
Root cause: measurement variations can look like real degradation when they are actually test setup differences. Solution: standardize measurement adapters, reference cables, and the exact port-to-port measurement procedure.
Cost and ROI note: what reliability link optimization typically costs
Budget for measurement tooling and inspection capability before buying extra optics. A calibrated power meter and light source plus a fiber inspection scope typically costs more upfront, but it reduces downtime and repeat truck rolls; many teams recover costs within a few avoided incidents. OEM optics often carry higher unit prices than third-party modules, but they may reduce compatibility surprises and simplify warranty handling; third-party can be economical if you maintain a validated compatible list and monitor DOM behavior for drift. TCO should include labor time for cleaning, inspection, and documentation, plus the expected failure rate of connectors due to patch churn.
FAQ
How does link optimization differ from basic fiber troubleshooting?
Basic troubleshooting usually reacts to a link failure. Link optimization treats margin as a measurable asset: you baseline DOM, measure optical power, confirm connector cleanliness, and validate error counters during maintenance so you prevent failures rather than just fix them.
What DOM metrics should I track during routine maintenance?
Track Rx power, laser bias current, laser output power, module temperature, and any vendor-defined warning or alarm flags. If your platform supports it, also trend error counters (CRC or equivalent) to confirm that optical margin aligns with real traffic health.
Which fiber test method is best: power measurement or OTDR?
Power measurement is efficient for confirming end-to-end loss and connector cleanliness. OTDR is better for locating event points along the route such as splices, bad connectors, or excessive attenuation caused by micro-bends, especially when you suspect physical damage.
Are third-party optics safe for link optimization and monitoring?
They can be safe if you restrict deployment to models verified for your switch platform and if DOM behavior matches your expectations. Validate with a test window that includes temperature and traffic stress, then keep strict spare and replacement procedures.
How often should we inspect and clean connectors?
For stable links with low patch churn, quarterly or semiannual inspection may be sufficient depending on environment. For high-move areas, inspect before each maintenance event and consider a monthly cadence for critical trunks.
What is the biggest cause of repeated link degradation?
In practice, the most common cause is connector contamination and re-contamination during patching, coupled with insufficient inspection. The second most common issue is inconsistent test methodology, which hides real degradation behind measurement variability.
If you want to improve reliability fast, start by baseline DOM, standardize optical measurements, and enforce connector inspection before mating. Next, expand your process to include OTDR event checks for any route that repeatedly shows low margin using link monitoring best practices.