If you are planning a 400G rollout, the hardest part is not picking optics, it is proving the cost analysis data center ROI with real numbers: port density, power draw, optics pricing, and failure risk. This article helps network and facilities teams build an upgrade business case they can defend to finance. You will also get a step-by-step implementation plan, plus troubleshooting for the most common 400G optics issues.
Prerequisites before you run the cost analysis data center
Before you touch spreadsheets, line up the inputs that typically make or break the ROI model. This includes your current link speed mix, actual utilization, optics vendor and part numbers, and measured power for your transceivers and switching ASICs. If you do not have measurements, plan a short pilot so your assumptions are not fantasy.
What to collect (minimum viable dataset)
- Inventory: current transceivers per speed (25G/40G/100G/200G) and connector type (LC/SC), plus vendor SKUs.
- Port counts: number of 400G-capable ports on ToR, spine, and aggregation switches.
- Traffic reality: 95th percentile utilization per interface or per port group.
- Power numbers: switch chassis power and optics module power (from datasheets or lab measurements).
- Costs: optics unit price, installation labor, expected spares, and any support contract deltas.
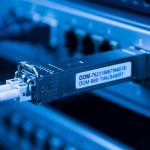
- Risk factors: MTBF/field failure notes, DOM availability, and warranty terms.
Operational note: For 400G, the optics ecosystem is heavily tied to the switch vendor’s optics compatibility list. That means your “cheapest module” may not be the one that actually works.
Pro Tip: In most 400G refresh projects, the ROI swings less on optics price and more on how many ports you can densify without adding chassis. If your upgrade lets you retire one extra switch stack, the savings can dominate optics cost in under 12 to 24 months.
Model the ROI drivers specifically for 400G optics
400G ROI is usually a blend of networking benefits (capacity and fewer switches) and operational savings (power, cooling, and reduced cabling churn). The key is to model each term with a defensible basis and show sensitivity for the top variables. Your goal is a spreadsheet that can survive procurement scrutiny.
ROI equation engineers can defend
Start with a simple annualized ROI view:
Net annual benefit = (CapEx avoided + OpEx savings + downtime risk reduction) – (incremental OpEx + annualized CapEx). Then compute payback and NPV.
- CapEx avoided: reduced number of switch ports/chassis, fewer line cards, fewer spares.
- OpEx savings: power savings from lower watt per delivered bit, reduced cooling energy, and lower maintenance labor.
- Downtime risk reduction: better optics reliability and faster RMA cycles can reduce outage impact.
For standards context: 400G Ethernet implementations commonly use IEEE 802.3 specifications for 400GBASE and link behavior, and many modules follow industry conventions for digital diagnostics over I2C. Use the vendor datasheet for exact optical and power specs because field behavior depends on the implementation details. anchor-text: IEEE 802.3 standard
What to assume for a realistic data center scenario
Assume a leaf-spine fabric where you upgrade existing 100G links to 400G on selected paths. You likely gain port density and reduce oversubscription pressure, which can reduce the need for additional switch tiers. If your 400G modules enable migration from four 100G ports to one 400G port (or from 2x200G to 1x400G), you can free rack space and power headroom.
Compare 400G transceiver options using real specs
For cost analysis data center work, you need a spec comparison that maps to your fiber plant and switching platform. The big choices are wavelength band, reach, and connector type, plus whether the module is direct-attach copper or fiber. In practice, you will also care about DOM support, operating temperature, and whether the module is “compatible but not guaranteed” for your exact switch model.
400G options you will actually see in deployments
- 400G SR8: multimode fiber, typically short reach; often used in ToR and within pods.
- 400G DR4: single-mode fiber, medium reach; common for inter-rack or intra-building.
- 400G FR4: longer single-mode reach, farther campus segments.
- 400G ZR/ZR-like: long reach single-mode; used when you need to span buildings or minimize intermediate gear.
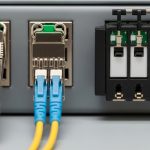
- 400G QSFP-DD vs OSFP: form factor must match your switch cage and vendor support list.
| Module type (typical) | Target media | Typical wavelength | Typical reach | Connector | Data rate | Power class (order-of-magnitude) | Temperature range |
|---|---|---|---|---|---|---|---|
| 400G SR8 (e.g., QSFP-DD) | OM4/OM5 multimode | 850 nm class | ~100 m (varies by spec) | LC (duplex MPO/MTP variants depending on design) | 400G Ethernet | ~10–15 W typical class | 0 to 70 C (commercial) or wider for enterprise |
| 400G DR4 (e.g., QSFP-DD) | Single-mode | ~1310 nm class | ~500 m (varies) | LC | 400G Ethernet | ~8–12 W typical class | -5 to 70 C typical enterprise |
| 400G FR4 (e.g., QSFP-DD) | Single-mode | ~1550 nm class | ~2 km (varies) | LC | 400G Ethernet | ~8–12 W typical class | -5 to 70 C typical enterprise |
| 400G ZR-like (e.g., OSFP/QSFP-DD) | Single-mode | ~1550 nm class | ~10 km (varies) | LC | 400G Ethernet | ~15–25 W typical class | 0 to 70 C typical |
Compatibility caveat: Even when specs look right, you must validate your switch vendor’s optics support. Many platforms enforce a transceiver vendor ID and may block unsupported optics at boot or during link bring-up.

Use DOM and link diagnostics as part of ROI
DOM (digital optical monitoring) reduces troubleshooting time, which directly affects availability. For ROI, treat “faster MTTR” as a quantifiable benefit: fewer truck rolls, fewer hours in degraded state, and faster RMA turnaround. In many environments, that benefit is larger than the difference between a premium and a third-party module.
Map optics choice to your fiber plant and port plan
Now connect the spec comparison to your actual cable plant. If you pick SR8 but your racks are connected with single-mode pigtails, your “cheap optics” becomes an expensive cabling project. Conversely, if you buy DR4 for a short in-rack distance, you may overspend on power and module cost.
Distance and budget alignment
Do a quick distance-to-reach mapping:
- Measure or pull records for patch-to-patch distance (including jumpers and patch panels).
- Validate fiber type: OM3/OM4/OM5 multimode vs single-mode OS1/OS2.
- Confirm loss budget with an OTDR or documented insertion loss. For multimode, consider modal bandwidth effects.
- Check connector type: LC vs MPO/MTP. SR8 frequently uses an MPO/MTP style interface in QSFP-DD implementations.
Account for form factor and port density
400G is often deployed using QSFP-DD or OSFP cages. If your switch uses one form factor, you cannot “cross-shop” modules freely. This is where your cost analysis data center model must include the cost of any additional adapter or, worse, a forced switch refresh.
Run the cost analysis data center with pricing and operational assumptions
At this stage, you convert the technical plan into dollars. Include three price tiers: OEM modules, reputable third-party modules with explicit compatibility, and your spares strategy. Then add power and cooling impacts using measured values when possible.
Realistic pricing ranges (what teams commonly see)
Prices vary by lead time, volume, and vendor, but for budgeting you can use order-of-magnitude ranges:
- OEM 400G SR8: often higher and strongly tied to switch vendor lists.
- Third-party 400G SR8/DR4: frequently 20% to 45% cheaper when compatibility is confirmed.
- Longer reach (FR4/ZR-like): higher unit cost and sometimes higher power draw.
OEM vs third-party TCO note: A cheaper module can increase labor if it causes repeated link bring-up issues, intermittent CRC errors, or inconsistent DOM behavior. For ROI, add a “compatibility penalty” probability based on your pilot results.

Power and cooling math that engineers actually use
Use the optics power in watts times the number of continuously powered ports. Then apply a facility power usage effectiveness factor (PUE) if your finance model requires it. Even a small delta per module can matter when you scale to thousands of ports.
Example approach: If optics are 10 W vs 15 W across 2,000 ports, that is 10,000 W difference. Multiply by operating hours and by your facility conversion factor to estimate annual energy delta.
Implementation plan for a low-risk 400G rollout
This is a practical step-by-step approach you can run in a production change window without guessing. The expected outcome after each step is explicit, so it is easier to manage risk and rollback.
Pilot in one pod or one spine pair
Action: Select one leaf-spine pair or one ToR group with representative distances and traffic. Install a small number of 400G links (for example, 8 to 16 ports) using the planned optics type and module vendor. Enable platform-level optics diagnostics and collect telemetry for link errors and DOM readings.
Expected outcome: Links come up cleanly, error counters stay stable under load, and DOM reports expected thresholds.
Validate interoperability and compatibility at the switch
Action: Verify optics acceptance on boot and during link negotiation. Confirm the module is recognized as supported by the platform, and check if any feature is disabled (like FEC mode selection, if applicable to your platform). Use vendor CLI commands to check optics and interface status.
Expected outcome: No “unsupported transceiver” warnings, no flapping, and stable negotiated parameters.
Roll out in maintenance windows with staged cabling
Action: Migrate one rack row or one pod at a time. Prefer “make-before-break” where supported, and label every fiber path so rollback is surgical. Update your change ticket with port mapping and optics part numbers.
Expected outcome: Each rollout completes within the planned window with minimal rollback events.
Update your inventory and spares strategy
Action: Record the exact optics SKUs, batch/lot if your vendor provides it, and DOM firmware behavior. Decide spares counts based on your MTTR and expected failure rates. Keep at least one spare per optics type per site or per critical fabric segment.
Expected outcome: Future replacements are fast, and your cost analysis data center model can be updated with real failure and RMA timelines.
Common mistakes and troubleshooting for 400G optics
400G failures can look mysterious, but most have root causes you can isolate quickly. Here are the top pitfalls field teams hit, with the most common causes and fixes.
Pitfall 1: Wrong fiber type or connector mismatch
Root cause: SR8 optics installed where the plant is single-mode, or MPO/MTP polarity and keying are incorrect. Sometimes the cabling is correct but the patch panel uses the wrong duplex mapping.
Solution: Confirm fiber type at the patch panel and validate polarity using a polarity tester or documented MPO polarity rules. Re-terminate or swap patch leads before you assume the optics are defective.
Pitfall 2: “It works on the bench but flaps in production”
Root cause: Temperature or airflow differences. Some optics behave differently under higher chassis thermal load, especially if airflow is blocked by dense patching or misrouted cables.
Solution: Measure module and chassis temperatures during peak load. Fix airflow obstructions, confirm fan tray health, and ensure optics meet the platform temperature specification.
Pitfall 3: Compatibility warnings and intermittent link errors
Root cause: Third-party optics not fully supported by your switch vendor firmware, or DOM thresholds not matching expected profiles. Another culprit is marginal connectors or dust on LC/MPO endfaces.
Solution: Clean connectors with approved tools, inspect endfaces, reseat modules, and verify the optics are on your platform’s compatibility list. If errors persist, run a controlled rollback to OEM modules to confirm root cause.
FAQ
How do I start the cost analysis data center for 400G?
Start with your current port utilization and the exact number of links you plan to upgrade. Then list optics unit costs, install labor, power draw, and expected spares. Build a sensitivity table for optics price, power delta, and downtime risk so finance sees what drives the result.
Are third-party 400G transceivers worth it?
Often yes, if the modules are explicitly compatible with your switch model and firmware version. The biggest risk is hidden incompatibility that shows up as warnings, unstable links, or limited diagnostics. Run a pilot and use DOM plus interface error counters to validate before scaling.
Which matters more for ROI: optics price or energy savings?
In many real rollouts, energy savings help but are rarely the single biggest driver. The bigger ROI lever is typically port density and CapEx avoided from reducing additional chassis or line cards. Energy becomes dominant when you scale to thousands of continuously active ports and have high electricity costs.
What specs should I verify before ordering 400G modules?
Verify wavelength and reach for your fiber type, connector interface (LC vs MPO/MTP), operating temperature range, and DOM support. Also confirm the form factor matches your switch cages (QSFP-DD vs OSFP) and that the module is on the vendor compatibility list.
What is the fastest troubleshooting path when a 400G link won’t come up?
First check optics recognition and interface status on the switch. Next verify fiber type, polarity, and connector cleanliness, then reseat modules and inspect endfaces. If it still fails, swap in a known-good module type from your spares to isolate whether the issue is optics or fiber.
Should I plan spares during the upgrade?
Yes. Without spares, a single failed module can turn into multi-day downtime while you wait for RMA shipping. A good baseline is keeping at least one spare per optics type per critical fabric segment, then adjusting after you see real failure patterns.
If you follow the steps above, you will end up with a defensible cost analysis data center ROI model and a rollout plan that minimizes surprises. Next, compare vendors and compatibility using 400G transceiver compatibility checklist to tighten your procurement risk before you place large orders.
Author bio: I design and operate high-availability data center networks and have deployed 400G transitions across leaf-spine fabrics with measured power and DOM telemetry. I write from field experience focused on failure modes, operational runbooks, and ROI models that hold up under audit.