Hot-plug transceivers are supposed to be “plug and play,” yet real outages often trace back to optics state, DOM monitoring visibility, and mismatched configuration. This article helps network engineers and field techs validate module health immediately after insertion, using measurable thresholds and vendor-safe procedures. You will get a top list of 8 practical checks, plus a troubleshooting section and a final ranking table to reduce tech debt and repeat failures.
Confirm physical link and optical budget before trusting DOM monitoring

DOM monitoring is only as useful as the link it describes. Start by verifying the interface is up and negotiating the expected lane rate, then confirm the fiber run matches the module’s reach and wavelength plan. For example, a 10G SR transceiver (850 nm multimode) will fail or show unstable receive power on long links, wrong core type, or if a fiber pair is swapped.
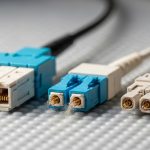
Key specs to anchor your check: wavelength (nm), reach (m), fiber type (OM3/OM4/OS2), and connector style (LC). Use the module label and vendor datasheet to confirm it is the correct SKU before you rely on DOM monitoring alarms.
- Best-fit scenario: Leaf-spine data center links with 10G SR optics where DOM monitoring helps detect aging and marginal receive power.
- Pros: Prevents chasing “bad DOM” that is actually a bad optical path.
- Cons: Requires discipline to verify optics and fiber mapping each change window.
Validate DOM monitoring telemetry fields your switch actually reads
DOM monitoring typically exposes temperature, supply voltage, bias current, transmit power, and receive power. However, what your switch can display depends on the platform’s transceiver support and the DOM interpretation logic. In practice, some switches surface only a subset of fields or apply vendor-specific scaling.
Cross-check the switch documentation for DOM behavior and alarm thresholds, and compare it to the module’s datasheet. If your switch reads temperature in Celsius but reports it with an offset, you can see false “over-temp” alerts.
| Parameter | 10G SR (Example) | 10G LR (Example) | What to verify in DOM monitoring |
|---|---|---|---|
| Data rate | 10G (10.3125 Gbps line) | 10G (10.3125 Gbps line) | Link speed / lane status vs optic type |
| Wavelength | 850 nm | 1310 nm | Wavelength must match fiber plant |
| Reach | 300 m (OM3) / 400 m (OM4) | 10 km | DOM can’t fix a too-long fiber run |
| Connector | LC | LC | Confirm correct physical port mapping |
| DOM fields | Temp, Vcc, Tx bias, Tx power, Rx power | Temp, Vcc, Tx bias, Tx power, Rx power | Ensure the switch reads the same units |
| Operating temp | Typically 0 to 70 C | Typically 0 to 70 C | Look for threshold crossings after insertion |
| Standards context | Compliant with IEEE 802.3 10GBASE-SR | Compliant with IEEE 802.3 10GBASE-LR | Use IEEE expectations for sanity checks |
Best-fit scenario: Mixed vendor optics in a multi-vendor fabric where DOM monitoring must be consistent for automation.
- Pros: Avoids “blind monitoring” where alarms don’t mean what you think.
- Cons: Requires reading platform optics docs and testing in staging.
Use a deterministic hot-plug workflow to avoid transient DOM monitoring noise
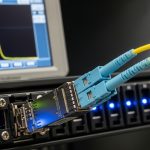
Immediately after hot-plug, optics may show short-lived telemetry shifts due to laser stabilization and receiver settling. If your monitoring system triggers alerts on the first sample, you can create false incidents. The fix is procedural: capture a baseline after a defined stabilization window and only then evaluate thresholds.
A typical field pattern is: insert transceiver, wait for link up, then wait an additional 30 to 120 seconds before logging “golden” DOM values. For automation, align sampling with the switch’s telemetry polling interval to avoid inconsistent readings.
Pro Tip: Many engineers treat DOM monitoring as instantaneous truth. In practice, the first telemetry burst after insertion can be misleading; delay baseline capture until the module reaches steady-state, then compare “post-stabilization” values to your historical range.
- Best-fit scenario: Live migrations where you replace optics during peak traffic and need stable DOM monitoring baselines.
- Pros: Cuts false positives and reduces pager fatigue.
- Cons: Adds a small delay to change execution.
Compare DOM monitoring thresholds to vendor datasheets, not generic ranges
DOM monitoring alarms are often implemented as “soft” or “hard” thresholds derived from the transceiver’s capabilities. Generic community ranges can be wrong for specific modules, especially across temperature grades and vendor families. Use the module datasheet for the expected ranges of Tx bias, Tx/Rx power, and voltage.
For example, a Finisar or FS.com 10G SR module may have different absolute bias current behavior at the same temperature than a Cisco-branded equivalent, even when both claim compliance with IEEE 802.3. You want relative drift tracking (trend) plus vendor-consistent absolute thresholds (limit checks).
- Best-fit scenario: You standardize on a few optics SKUs and want reliable alarm semantics for proactive maintenance.
- Pros: Less alert churn, better root-cause accuracy.
- Cons: Datasheet review adds upfront effort.
Ensure firmware and switch compatibility for DOM monitoring telemetry and alarms
Transceiver support is a combination of hardware capability and switch firmware behavior. A firmware upgrade can change how DOM monitoring is parsed, which can break dashboards or alter threshold logic. Before enabling automation, test DOM monitoring fields after any switch firmware change in a maintenance window.
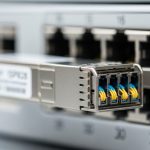
Also confirm the module form factor matches the port type: SFP vs SFP+ vs QSFP+ vs QSFP28 (and their electrical expectations). Even when the physical connector matches, mismatched electrical profiles can lead to link flaps that DOM monitoring only reports after the fact.
- Best-fit scenario: Multi-cluster environments where firmware rollouts are frequent.
- Pros: Prevents “monitoring regressions” that look like hardware failures.
- Cons: Requires a compatibility matrix and change management discipline.
Track DOM monitoring drift to catch failing optics before link loss
Instead of relying only on alarm state, track drift in DOM monitoring metrics over time. A common failure pattern is increasing Tx bias current with decreasing received power at the far end, indicating transmitter aging or fiber contamination. Set trend alarms on slopes, not just absolute values.
In a typical 3-tier data center, you may have hundreds of 10G SR links between ToR and aggregation. If you sample DOM monitoring hourly and store it in a time-series database, you can identify outliers: e.g., a link where Rx power drops by 3 dB faster than peers over two months. That often leads to cleaning or patch-panel remapping before any outage.
- Best-fit scenario: Proactive maintenance for high-density access layers.
- Pros: Converts reactive tickets into planned work.
- Cons: Needs data retention, baselining, and careful threshold tuning.
Selection checklist: what engineers verify before trusting DOM monitoring
Use this ordered checklist during procurement, pre-install verification, and post-install validation. It reduces tech debt by standardizing optics behavior and monitoring semantics.
- Distance & fiber type: OM3/OM4/OS2, connector type, and patch loss budget.
- Data rate and interface standard: confirm IEEE 802.3 target (SR vs LR vs ER) and port speed.
- Switch compatibility: verify the exact module family is supported by your firmware.
- DOM monitoring support: confirm telemetry fields and units your switch exposes.
- DOM alarm behavior: compare thresholds to the vendor datasheet; avoid “generic” alerting.
- Operating temperature grade: match expected environment and airflow constraints.
- Vendor lock-in risk: plan for third-party optics if your OEM has restrictive policies.
- Best-fit scenario: You are building an optics standard for a large fleet and want predictable monitoring.
- Pros: Fewer surprises during change windows.
- Cons: Takes time during standardization and pilot testing.
Common mistakes and troubleshooting for hot-plug DOM monitoring
Here are the failure modes that most often produce misleading DOM monitoring results or persistent alarms after a hot-plug install.
-
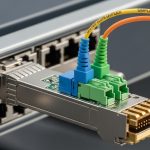
Mistake: Swapping transmit and receive fibers after insertion.
Root cause: Tx/Rx polarity mismatch; DOM will show low Rx power or high error-rate behavior.
Solution: Verify patch cord orientation at the LC ends; use a consistent labeling scheme and confirm with a link test. -
Mistake: Interpreting first-second DOM telemetry as steady-state.
Root cause: Laser stabilization and receiver settling create transient values.
Solution: Wait 30 to 120 seconds after link-up before recording baselines and triggering trend analysis. -
Mistake: Using generic power thresholds across module vendors.
Root cause: Different vendor optics report telemetry scaling and operational behavior differently.
Solution: Use the module datasheet and compare to peer links of the same SKU; set per-SKU or per-vendor baselines. -
Mistake: Firmware mismatch causing DOM parsing differences.
Root cause: Switch firmware updates can change DOM field mapping or alarm logic.
Solution: Validate DOM monitoring fields after firmware upgrades; update dashboards and alert rules accordingly.
Best-fit scenario: You are in a sustained incident where DOM monitoring looks “wrong,” but the optics or configuration is actually correct.
- Pros: Faster isolation between optics issues and monitoring artifacts.
- Cons: Requires a runbook and disciplined evidence collection.
Summary ranking: which DOM monitoring checks matter most
Use this quick ranking table during change windows. “Impact” reflects how often the check prevents real outages or reduces false alarms.
| Rank | Check | Impact | Effort |
|---|---|---|---|
| 1 | Fiber polarity and optical budget sanity | High | Low |
| 2 | DOM telemetry fields and units match switch | High | Medium |
| 3 | Stabilization window before baseline capture | Medium | Low |
| 4 | Vendor datasheet-aligned thresholds | Medium | Medium |
| 5 | Firmware compatibility validation | Medium | Medium |
| 6 | Trend-based drift detection | Medium | High |
| 7 | Selection checklist during procurement | Medium | Medium |
| 8 | Troubleshooting runbook discipline | High during incidents | Low |
FAQ
What is DOM monitoring, and what does it measure on a transceiver?
DOM monitoring reads on-module telemetry such as temperature, supply voltage, laser bias current, and optical transmit and receive power. The exact fields and